Download
1 / 18
180 likes | 363 Views
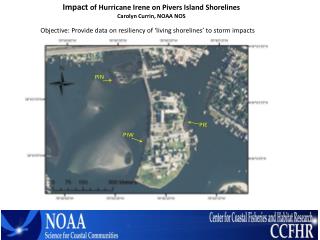
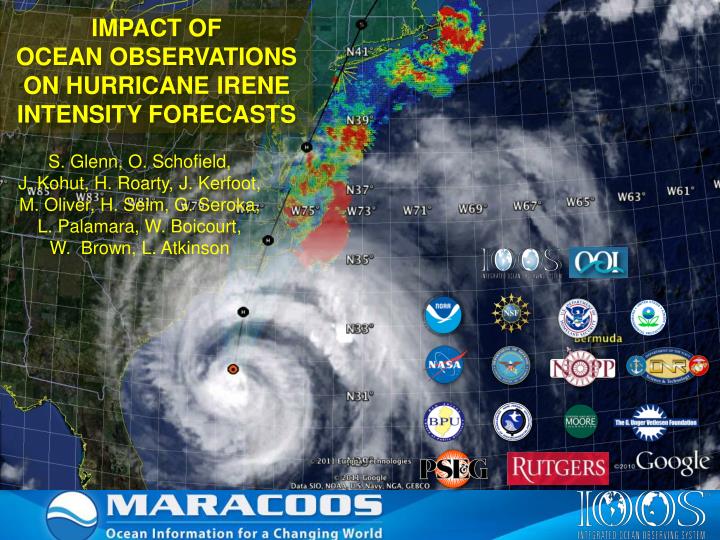
IMPACT OF OCEAN OBSERVATIONS ON HURRICANE IRENE INTENSITY FORECASTS. S. Glenn , O. Schofield, J. Kohut , H. Roarty , J. Kerfoot , M. Oliver , H. Seim , G. Seroka , L. Palamara , W. Boicourt , W. Brown, L. Atkinson. U. M iddle A tlantic R egional A ssociation

E N D
IMPACT OF OCEAN OBSERVATIONS ON HURRICANE IRENE INTENSITY FORECASTS S. Glenn, O. Schofield, J. Kohut, H. Roarty, J. Kerfoot, M. Oliver, H. Seim, G. Seroka, L. Palamara, W. Boicourt,W. Brown, L. Atkinson
U.. Middle Atlantic Regional Association Coastal Ocean Observing System 1000 km Cape to Cape RI Cape Cod CT MA NY 10 States PA NJ Regional Association – 2004 Regional Coastal Ocean Observing System – 2007 DE MD VA NC Cape Hatteras Gliders Forecasts CODAR L-Band X-Band
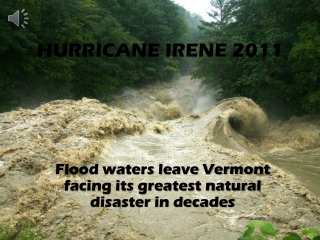
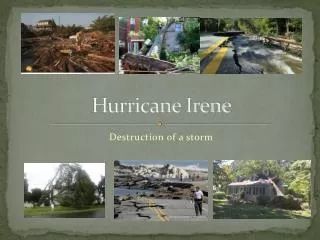
Hurricane Irene Aug 20-29 Total inches of rainfall 0 32 • First tropical storm to threaten NYC since Hurricane Gloria in 1985 • Flooding records broken in 26 rivers • Caused at least 56 deaths • Damage nearly $8 billion
Hurricane Irene 39.5N 73W Surface Current Time Series Total CurrentNear-Inertial Current Wave & Wind Direction Time Series
Hurricane Irene Inertial Response Direct Wind Forcing
Two Gliders Deployed by MARACOOS in Hurricane Irene • RU23 • Deployed for MARACOOS. • Map subsurface T/S structure for fisheries. • Damaged early - drifter • Recovered by fisherman • Provided data on inertial currents during storm. • RU16 • Deployed for EPA. • Map bottom dissolved oxygen. • Provided data on mixing during storm.
Hurricane Irene Hurricane Irene 0 26 depth temperature 14 55 0 33 depth salinity 29 55 0 105 depth % oxygen 55 60 date 8/12 9/07
RU16 Temp. Section Upcast Downcast Temp. Vert. Vel. Temp. Vert. Vel. Temp. Vert. Vel.
For Each 2-hour Segment: 1) Calculate the Average Temperature Profile 2) Calculate the Vertical Velocity Standard Deviation Profile and Smooth Vertically. Temp S.D. w’ Pre-Irene Post-Irene During Irene
Time History of Mixing During Irene: Profiles of the Standard Deviation Vertical Velocity Profile Temp S.D. w’ Time Progresses from Red to Blue
Time History of Mixing During Irene: Profiles of the Standard Deviation Vertical Velocity Profile Eddy viscosity Linear * Exponential Decay Linear Time Progresses from Red to Blue
Time Series of Derived Parameters NOAA Delaware Bay Buoy Glider RU16 Thermocline Depth Wind Speed Wave Height Surface Temp Wave Period Max S.D. w’ Depth Max S.D. w’ Wave Bottom Orbital Velocity
WRF Model Run: SST Update 28/060029/0600 27/120028/0600
Run Comparison WARM (RTG only) COLD “Update” (AVHRR)
Wind Speed Error Hurricane Irene - U.S. IOOS as it is designed – A multi-agency activity. Make Observations > Advance the Science > Improve the Forecasts • U.S. IOOS interactive observatory network closes a gap in storm science. • Bottom boundary layer mixing is responsible for surface layer cooling. • The cooling occurs rapidly during the peak in the storm waves. • Cooler sea surface temperatures reduce hurricane forecast intensities. • U.S. IOOS could produce better hurricane forecasts now.