Download
1 / 12
120 likes | 465 Views
Early Years Foundation Stage. -A Good Level of Development (GLD) requires meeting or exceeding all the Prime Early Learning Goals (ELG) and Literacy and Mathematics.

E N D
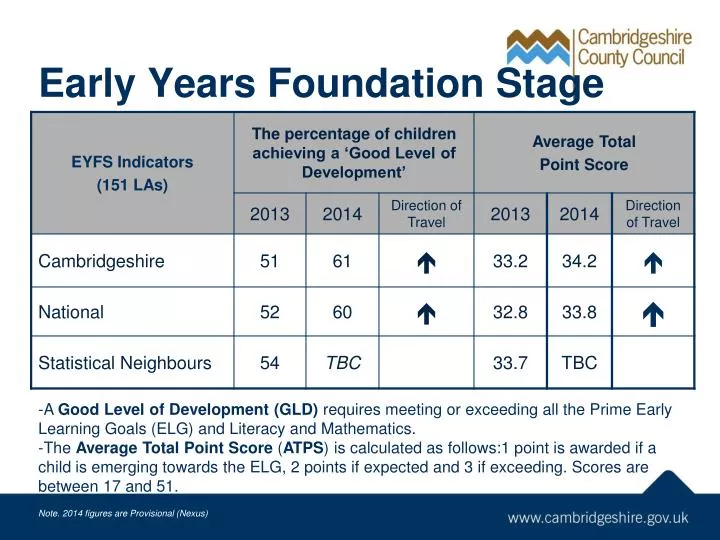
Early Years Foundation Stage -A Good Level of Development (GLD) requires meeting or exceeding all the Prime Early Learning Goals (ELG) and Literacy and Mathematics. -The Average Total Point Score (ATPS) is calculated as follows:1 point is awarded if a child is emerging towards the ELG, 2 points if expected and 3 if exceeding. Scores are between 17 and 51. Note. 2014 figures are Provisional (Nexus)
‘Vulnerable Groups’ Note. 2014 figures are Provisional (Nexus)
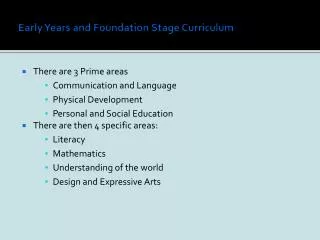
% achieving ELG in Prime Areas ELG = Early Learning Goal Note. 2014 figures are Provisional (Nexus)
% achieving ELG in Literacy and Mathematics Note. 2014 figures are Provisional (Nexus)
Year 1 Phonic Screening Check First indications are that Cambridgeshire performance has improved but at a slightly slower rate than seen nationally. Note. 2014 figures are Provisional (Nexus)
Key Stage 1: Level 2+ Results have provisionally improved this year. Cambridgeshire performance is provisionally above the national level and broadly in line with SN. Note. 2014 figures are Provisional (Nexus)
Key Stage 2: Level 4+ The benchmark for Key Stage 2 is achieving L4+ in Reading, in Writing and in Maths. Results have provisionally improved this year in Reading, Writing and in Maths reversing the decline seen in 2013. However, Cambridgeshire performance is still below the national level in each subject and in all three combined. Note. DfE SFR 30/2014 28 August 2014 - figures are provisional
Key Stage 2: Level 5+ Note. DfE SFR 30/2014 28 August 2014 - figures are provisional
‘Vulnerable Groups’ Note. 2014 figures are Provisional (Nexus)
Key Stage 1-2: Progress Pupils are expected to make at least two levels of progress between Key Stage 1 and Key Stage 2. Cambridgeshire’s performance has improved by 3ppt in Reading and by 2ppt in both Writing and Maths. Cambridgeshire performance is improving at the same rate as seen by our statistical neighbours and we gave closed the gap between our own and national performance by 1ppt in both Writing and Maths. Note. DfE SFR 30/2014 28 August 2014 - figures are provisional
Key Stage 4 (GCSE) (Based on provisional returns from schools/academies) First indications are that Cambridgeshire performance for 5+ GCSE grades A*-C, including English and Maths ‘best result’ is in-line with 2013 (61%). The new ‘first entry’ measure is 4ppt lower at 57%. First indications show that the proportion of Cambridgeshire pupils achieving grades A*-C in GCSE English have improved by 3ppt (to 72%) but declined by 2.5ppt in Maths (to 70.5%). 11
The Percentage of pupils achieving 5+ GCSE grades A*-C including English and Maths (all pupils) 12