Download
1 / 60
600 likes | 794 Views
Defining The Cancer Burden for Cancer Control. Presented by Thomas C. Tucker, PhD, MPH Associate Professor Department of Epidemiology College of Public Health University of Kentucky Associate Director for Cancer Control Markey Cancer Center University of Kentucky

E N D
Defining The Cancer Burden for Cancer Control Presented by Thomas C. Tucker, PhD, MPH Associate Professor Department of Epidemiology College of Public Health University of Kentucky Associate Director for Cancer Control Markey Cancer Center University of Kentucky Director of the Kentucky Cancer Registry CCC Workshop - Atlanta, Georgia - August 7, 2012
Topics to be covered • What is Cancer Control & why is data important? • How do we measures the cancer burden? • What are the major sources of data that can be used to describe the burden of cancer? • Some specific limitations associated with using central cancer registry data for cancer control. • What are the major cancer control sites? • What is the logic model for using these major sources of data to define the burden of cancer? • Combining sources of data to define the burden of cancer for the major cancer control sites in specific geographic areas? • An example of how this process has worked.
What is “Cancer Control”? The use of evidence based prevention, early detection, treatment, and continuing care intervention strategies to reduce cancer incidence, morbidity and mortality in defined populations.
Phases of Cancer Control Early Detection Continuing Care Prevention Diagnosis Treatment
Data and Cancer Control What is striking about the definition of cancer control are it’s implications for the use of data at all phases of the cancer control continuum. Muir, et al. have said that “data are an essential part of any rational program of cancer control”. In fact, it is difficult to imagine any effective cancer control efforts that do not rely on some type of data collection and analysis. In essence, data represent the eyes of our cancer control program. Without these eyes, it would not be possible to see our cancer control problems and it would not be possible to see the impact of our cancer control activities.
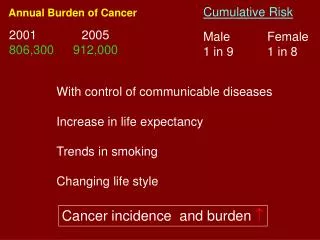
What are the common sources of data that can be used for defining the cancer burden? • Demographic data (Census U.S) • Risk factor data (BRFSS) • Incidence data (KCR) • Mortality data (State Vital Records)
Demographic (Census) data • Covers the entire population • Provides details on important factors that influence the burden of cancer in a population • Is only done once every 10 years in the U.S. • Is difficult to determine the number of people in a population by race and ethnicity.
Behavioral Risk Factor Surveillance System • Largest telephone survey in the world • Tracks many important health risks • Complex sample design • Difficult to generalize the information to small populations
IncidenceData • Closer in time to causal events • Represents both occurrence and risk of getting disease • Difficult to get all of the cases • Complex coding rules • Screening effect
Mortality Data • Very complete data • Represents the ultimate negative health outcome • Far away in time from causal factors • Care must be taken to use consolidated death records
Difficulties Associated with Using Central Cancer Registry Data for Cancer Prevention and Control • The screening effect • Difficulties associated with the occurrence of cancer in very small populations
Screening Effect • What happens to the female breast cancer incidence rate in a population when more women have mammography screening? • What happens to the colorectal cancer incidence rate in a population when more people are screened using colonoscopy?
Difficulties associated with the occurrence of cancer in very small populations • The difference between “counts” (frequency) and “rates” (Risk). • Community A:Population 1 million, Count =1000 cases Crude Rate = 1000/1,000,000x100,000 =100 per 100,000 Pop. • Community B:Population 100,000, Count =100 cases Crude Rate = 100/100,000x100,000 =100 per 100,000 Pop. • Community C:Population 1000, Count =2 casesCrude Rate = 2/1000x100,000 =200 per 100,000 Pop.
Difficulties associated with the occurrence of cancer in very small populations (Cont.) • Sentinel surveillance techniques can be used when communities have small populations and low cases counts. • Population scientists can help determine if the frequency of cancer is normal (endemic) or abnormal (epidemic). • Cancer rates are considered to be unstable when case counts are less then 15.
Most Common Cancer Control Sites58 % of Total Cancer Cases in the U.S.
Most Common Cancer Control Sites62 % of Total Cancer Cases in KentuckyAll genders, all races, 2001-2005
Most Common Cancer Control Sites59 % of Total Cancers Deaths in KentuckyAll genders, all races, 2001-2005
Combining Data from Multiple Sources Demographic Characteristics Contribute to Risk Factors Contribute to Incidence and Late Stage DX Contribute to Cancer Mortality Logic Model
Methodology (Approach) Used in the C-Change/NAACCR Project • The association between the demographic, risk, incidence, stage at diagnosis and mortality variables were explored using bivariate regression models. • Variables with R-Squared values .25 or greater were used to construct the initial index for each type of cancer. • The index was created using a simple rank sum technique. States were ranked from the highest to lowest cancer burden and placed into five groups with red being the states with the highest burden of cancer and green being those states with the lowest cancer burden.
Summery of top ten states with the highest burden for each type of cancer
Cancer Control in Kentucky The Kentucky Cancer Registry develops a profile of the cancer burden for the major cancers in each of the states 15 Area Development Districts (ADD’s) and presents these data annually to the District Cancer Councils that have been established in each ADD
Model for Cancer Control (Cancer control can be defined as “activities designed to reduce morbidity and mortality from cancer”) Measure Plan Act Measure Identify Problem Select Target Population Develop Intervention Strategy Implement Intervention Plan Evaluate the Impact of Intervention Registry Data Other Data Health Care Providers Community Health Care Providers Others Registry Data Other Data Kentucky Cancer Program
Lung Cancer Rank for Area Development District in KY 2004-08
Breast Cancer by Area Development District in KY (2004-2008)
BreastCancer Rank for Area Development District in KY 2004-08
Colorectal Cancer By Area Development District in KY 2004-08 * Mortality Rates for US is 2003-07
Colorectal Cancer Rank for Area Development District in KY 2004-08
An Example In 2001, Kentucky had the highest colorectal cancer incidence rate in the U.S. compared to all of the other states
In 2001, it was also noted that Kentucky was ranked 49th in colorectal cancer screening compared to all other states with the second to the lowest rate (34.7% of the age eligible population).