Download
1 / 26
260 likes | 471 Views
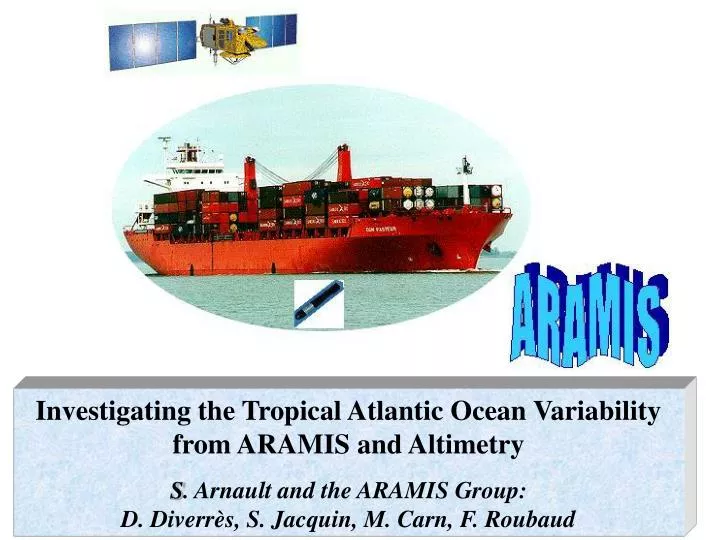
Investigating the Tropical Atlantic Ocean Variability from ARAMIS and Altimetry S . Arnault and the ARAMIS Group: D. Diverrès, S. Jacquin, M. Carn, F. Roubaud. Sea Surface Salinity. World Ocean Atlas 2001 Ocean Climate Laboratory NODC. Tropical Atlantic Surface Currents. Westward.

E N D
Investigating the Tropical Atlantic Ocean Variability from ARAMIS and Altimetry S. Arnault and the ARAMIS Group: D. Diverrès, S. Jacquin, M. Carn, F. Roubaud
Sea Surface Salinity World Ocean Atlas 2001 Ocean Climate Laboratory NODC
Tropical Atlantic Surface Currents Westward Eastward From Stramma and Schottt, 1999
2 experiments / year: Boreal spring and fall 50 XBTs and 50 XCTDs between 20°S and 35°N alternately every 50 km TSG SSS and SST During the last cruises, chemical samplings CO2 ARAMIS : Altimétrie sur un Rail Atlantique et Mesures In Situ
3 PHASES PHASE 1: 2002-2003 Jason CALVAL Experiment PHASE 2: 2004-2007 Data Acquirement Statistics pCO2 start PHASE 3: After 2007 Operational Mode ARAMIS Present Status ARAMIS 1 July 2002 ARAMIS 2 March 2003ARAMIS 3 Oct. 2003 ARAMIS 4 May 2004 ARAMIS 5 Sept. 2004 ARAMIS 6 April 2005 ARAMIS 7 Oct. 2005 ARAMIS aims Monitoring the Tropical Atlantic Heat Content variability Monitoring the NEC, NECC and SEC transport variability Monitoring the SSS and SST variability Monitoring the Smax water variability
ARAMIS Phase 1- Jason Calval: Sea Level Anomaly Comparison July 2002 March 2003
Geostrophic Current Comparison July 2002 March 2003
Sea Level Comparison Mean Sea Surface "Rio" EMG96 Geoid Grace Geoid
ARAMIS Phase 2-Data acquirement: TSG Variability > 10 °C Variability > 4.5 °C VariabilityMinimum
SST warmer during the summer and fall of the respective hemisphere
Year to year variability larger : • in the northern hemisphere - during fall
Variability > 2.5 psu Variability < 1 psu Variability < 1 psu
SSS minimum moves northward in relation with ITCZ August May July
March 2003 ARAMIS Phase 2-Data acquirement: XBT and XCTD October 2003
2002 Spring Fall Summer 2003 2004 2005
2002 Spring Fall Summer 2003 2004 2005
Mixed LayerDepth Barrier Layer Isothermal Layer Depth Barrier Layer Analysis from ARAMIS data Coll. A. Lazar and D. Bonhoure Sprintall et Tomczak [1992] : BL Tropical Atlantic 5°-20°N 55°-35°W. ☼ Amzone and Orenoque rivers run off ☼ NorthMaximum Salinity Water advection Pallier, Bourlès et Gouriou [1999] : BL Tropical Atlantic 5°-20°N 55°-35°W. ☼ Amzone and Orenoque rivers run off ☼ SouthMaximum Salinity Water advectionfrom North Brazil UnderCurrent
More than 15 different criteria used in the litterature to compute the Isothermal Layer Depth (ILD), the Mixed Layer Depth (MLD) and the Barrier Layer (BL) in the global Ocean • Only 4 used here: • Kara et al. (2000) for global ocean: • Δσt = σt(T+ΔT,S,P0) - σt(T,S,P0) where ΔT=0.8°C • De Boyer Montégut et al. (2004) for global ocean: • Δσt • Δσt = ΔT where ΔT=0.2°C • σt • Sprintall and Tomczak (1992) for the tropical Atlantic and Pacific Oceans • Δσt • Δσt = ΔT where ΔT=0.5°C • σt • Pailler et al. (1999) for the tropical Atlantic • Maximum Gradient
Comparison of the computed ARAMIS BL and de Boyer Montegut’s Climatology using the same ΔT=0.2C criteria
Based on statistics (correlations, RMS diffferences and linear regressions), ILD computed either with ΔT =0.5 or ΔT =0.8C is the best criterion for the tropical Atlantic Ocean ΔT =0.2C is better for high latitudes Maximum gradient is too noisy for in situ measurements
Based on statistics (correlations, RMS diffferences and linear regressions), MLD computed either with ΔT =0.5 or ΔT =0.8C is the best criterion for the tropical Atlantic Ocean ΔT =0.2C is better for high latitudes Maximum gradient is too noisy for in situ measurements
Surface fresh waters advected by the South Equatorial Current North Equatorial CounterCurrent Advection Sub-surface high salinity waters due to horizontal advection of the South Maximum Salinity Water
Future • Continuation of ML, ILD, BL study on the more recents cruises • Comparison with a OGCM model (forecast system) • Continuation of data acquirement + chemical analysis • Monitoring the Tropical Atlantic Heat Content variability • Monitoring the NEC, NECC and SEC transport variability • Monitoring the SSS and SST variability • Monitoring the Smax water variability