Download
1 / 57
570 likes | 596 Views
Dive into the intricate relationship between the Meridional and Equatorial modes of Tropical Atlantic Variability, analyzing seasonal cycles, SST, thermocline movements, and wind patterns. Understand the influences of ENSO and NAO, with empirical orthogonal function analysis shedding light on this dynamic system. Unravel the modes' interplay and potential divergence over different timescales through comprehensive data sets and regression analysis.

E N D
Tropical Atlantic Variability Ching-Yee Chang 張 靜 宜 University of Maryland The Department of Atmospheric Sciences and Institute of Atmospheric Physics National Central University, December 18 2007
Outline • Introduction: Seasonal cycle, and Tropical Atlantic Variability • The relationship between the Meridional and Equatorial modes • Spring-time equatorial westerly wind bias of the CAM3 and CCSM3 model output
Tropical Atlantic • Atlantic about 1/3 of Pacific in width • Tropical Atlantic more land-locked Similarity to Pacific Ocean The tilting coastline in the eastern boundary
Seasonal cycle • Sea Surface Temperature (SST) • Thermocline • Surface winds • InterTropical Convergence Zone (ITCZ)
4°N-4°S,16°W-4°E Depth of thermocline (ave. btw 3S-2N) Scatter diagram of monthly mean SST (Mitchell and Wallace 1992) Sea Surface Temperature (SST) Warmest in MAM; coldest in JJA Thermocline: Flat and “deep” in MAM Steep and “shallow” in JJA
Surface winds • Southeastern Trade winds relax in Mar-Aprs • Southeastern trade winds strengthen in Jun-Jul
Precipitation • ITCZ in its most Southern position in Apr-May
Tropical Atlantic Variability (TAV) modes • Equatorial mode (zonal mode, Atlantic Nino) • Meridional mode (dipole mode, gradient mode) • ENSO influence • NAO influence
Empirical Orthogonal Function (EOF) analysis • Decomposition of the climate variability into a linear combination of base functions (EOFs) • EOFs are eigenvectors of a covariance matrix • Each EOF has a corresponding Principal Component (PC), which is the time series of the magnitude of the EOF • EOFs are spatially and temporally orthogonal
JJA climatological SST Equatorial (zonal) mode • Oftener and stronger in June, July, August • Warm/cold anomaly in the eastern basin near the equator • Zonal winds anomalies along the equator • Equatorial thermocline movement Ruiz-Barradas et al. 2000. Regression to the PC of a 5-variable rotated EOF analysis
MAM climatological SST Meridional (dipole) mode • Oftener and stronger in March, April, May • Meridional gradient of SST anomaly • Cross-equatorial flow • North-south shift of ITCZ • Reduced/increased trade winds in different hemispheres Ruiz-Barradas et al. 2000. Regression to PC of a 5-variable rotated EOF analysis
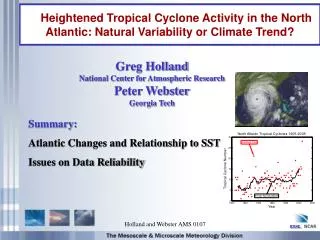
The Meridional and Equatorial Modes of Tropical Atlantic Variability: Related? Ching-Yee Chang James Carton Sumant Nigam
The relationship of the two modes • Servain et al., 1999 and 2000 • Related at decadal and short-interannual time scale. • zonal mode leading dipole mode • Murtugudde et al., 2001 • The correlation of the two modes falls apart when a longer time-series data were used • dipole mode leading zonal mode • Okumura and Xie, 2006 • Nov-Dec equatorial SSTA related to following Mar-Apr dipole index
EOF analysis on SST anomaly of different seasons • Apply EOF analysis separately for MAM and JJA averaged SST anomalies. Data SST Data for EOF analysis: Hadley SST, 1949-2002 Other datasets: Wind: NCAR-NCEP reanalysis, 1949-2002 Precipitation: CRU TS 2.1, 1949-2002
37.5 % 41.1 % EOF patterns and PCs Correlation coefficient=0.71
41.9 % 43.6 % ENSO influence removed • Remove the regression of monthly SSTA onto DJF Nino3 index The correlation is not resulted from ENSO
1958 1984 Dipole mode leading to zonal mode • Dipole pattern in spring • Later on, along the equator, a corresponding phase of SST anomaly strengthens Cl=0.2ºC
22.4 % 42.0 % GFDL cm2.1 model, flux corrected
Spring dipole PC and meridional winds Summer zonal PC and meridional winds Regression of PC and meridional winds Contours: regression coefficients; Shading: significant correlation (above 95%)
Spring dipole PC and zonal winds Summer zonal PC and zonal winds Regression of PC and zonal winds Wind anomaly patterns that are related to one mode are also related to the other mode
Regression of SSTA onto May western equatorial zonal winds Correlation of equatorial zonal wind and E. equatorial SSTA (Okumura and Xie, 2006) Dipole patterns change into zonal patterns May zonal wind anomaly related to dipole pattern of SSTA at earlier time
Regression of Meridional winds onto JJA Atl3 index • Warm JJA equatorial SSTA related to convergence flow to the equatorial in Jun, July, August • Warm JJA equatorial SSTA related to cross-equatorial flow in March, April, May
Climatological zonal winds May June Red line is the place of zero meridional winds ~ position of ITCZ
Cold SSTA Warm SSTA Warm SSTA Cold SSTA
Regression of African Precipitation onto PCs JJA zonal PC Mar.Apr May.Jun Jul.Aug MAM dipole PC Equatorial SSTA highly related to the precipitation anomaly along the Coast of Guinea Precipitation Climatology
Mar.Apr May.Jun Jul.Aug MAM-dipole PC JJA-zonal PC Climatological precipitation
Corr = 0.71 Corr = 0.51 Corr = 0.76
0.65 0.71 0.70 0.72 Spring EOF1 Winter EOF1 Prediction of Amazonian rainfall using DJF EOF/PC1 Fall EOF1 Summer EOF1
Mar.Apr May.Jun Jul.Aug MAM-dipole PC DJF PC1 Climatological precipitation
0.65 0.43 0.37 0.71 0.70 0.58 0.34 0.72
Regression of PC and African Precipitation Mar.Apr May.Jun Jul.Aug DJF PC1 and precip JJA zonal PC and precip. Precipitation Climatology
Extra-tropics influencing tropics • Czaja et al. 2002: remote forcing to the North Atlantic SSTA DJF NAO corr with MAM SSTA
Summary I • Spring-time dipole mode is highly correlated to the summer-time zonal mode. • This relationship is not due to ENSO • Western equatorial zonal wind anomaly is the bridge • Anomalous meridional movement of ITCZ can result in zonal wind anomaly • This relationship can be helpful in predicting West African rainfall
The origin of the spring-time westerlies in the equatorial Atlantic in CAM3 and CCSM3 Ching-Yee Chang Sumant Nigam James Carton Semyon Grodsky Chang et al, 2007. Seasonal Climate of the Tropical Atlantic Sector in the NCAR Community Climate System Model 3: Error Structure and Probable Causes of Errors. J. Climate Chang et al, 2008. Origin of the Spring-time Westerly Bias in Equatorial Atlantic Surface Winds in CAM3 Model Simulations. J. Climate. In revision
Bias structures of the seasonal climate in the tropical Atlantic in CCSM3 and CAM3 Observational data SST: Hybrid Reynolds and Smith Winds: SSMI GPCP precipitation ERA40 reanalysis SODA Model output data CCSM3: 20C3M, T85_gx1v3 CAM3: AMIP run, T85
Precipitation ` ` Extra rainfall in Africa Deficient Rainfall in S. America ITCZ southward shift
Depth of thermocline Equatorial surface zonal winds SST standard deviation (Deser et al. 2006) red: CCSM3 blue: observation
Depth of thermocline Equatorial surface zonal winds red: CCSM3 blue: observation
Some possible origins of the westerly winds • Rainfall deficiency in tropical South America • Extra rainfall in tropical Africa • Southward shift of ITCZ
Diagnosis of the origin of the westerly wind bias using a diagnostic model
Diagnostic linear model • Linear • Primitive equation • Dry model • Steady state • Forcings: diabatic heating, eddy momentum flux, topography……. • In this study, CAM3 and ERA40 diabatic heatings are the forcing to the model.
Assessment of the diagnostic model Zonally asymmetric components of SLP and surface winds
Equatorial zonal winds Why diabatic heating?
Simulated bias: Effect of S. America heating Contour: SLP Vector: winds • Westerly wind bias due to land heating bias equally important as the oceanic heating
Simulated bias: Effect of African heating Contour: SLP Vector: winds • Effect due to African land heating is small and confined