Download
1 / 38
420 likes | 643 Views
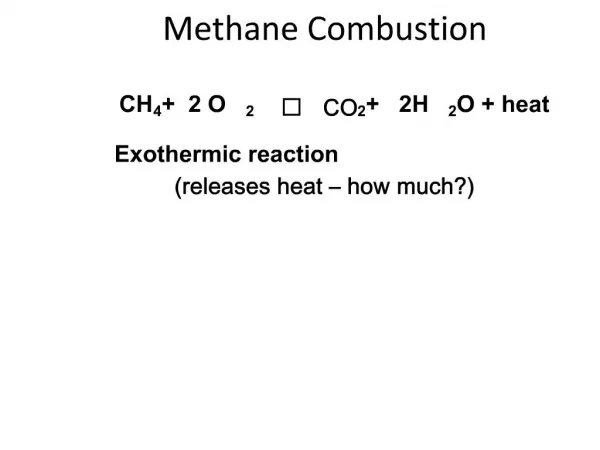
Combustion. CIET,LAM,DEPARTMENT OF MECHANICAL ENGINEERING. Introduction. Definition of combustion Combustion is a chemical reaction in which certain elements of the fuel like hydrogen and carbon combine with oxygen liberating heat energy and causing an increase in temperature of the gases

E N D
Combustion CIET,LAM,DEPARTMENT OF MECHANICAL ENGINEERING
Introduction • Definition of combustion • Combustion is a chemical reaction in which certain elements of the fuel like hydrogen and carbon combine with oxygen liberating heat energy and causing an increase in temperature of the gases • Presence of combustible mixture and means of initiating the process are necessary • Homogeneous mixture • Heterogeneous mixture
Homogeneous mixture from carburetor Combustion in S.I.Engines Piston at the end of compression stroke Combustion initiated by spark plug Burnt mixture Un burnt mixture Flame front spreading over a combustible mixture with certain velocity Flame propagation
Combustion in S.I.Engines Flame propagation is caused by heat transfer and diffusion of burning fuel molecules from the combustion zone to the adjacent layers of un burnt mixture. Burnt mixture Un burnt mixture Flame front is a narrow zone separating the fresh mixture from the combustion products The velocity with which the flame front moves w.r.t. the unburned mixture in a direction normal to its surface is called the NORMAL FLAME VELOCITY Flame propagation Flame speed ≈ 40 cm/s, for =1 Max. Flame speed occurs at =1.1 to 1.2 ( slightly rich mixture) For Richer mixtures Flame extinguishes as with the speed drops. Qloss from combustion = Qdue to combustion Flame speed can be increased by introducing turbulence and proper air movement The rate of chemical reaction determines the combustion characteristics
Combustion in C.I.Engines Combustion starts in the zones where =1.1 to 1.2 corresponding to maximum rate of chemical reaction Piston at the end of compression Fuel injection The rate of combustion is determined by the velocity of mutual diffusion of fuel vapors and air and the rate of chemical reaction is of minor importance Self-ignition or spontaneous ignition of F-A mixture at high temperature developed due to higher compression ratios, is of primary importance in determining the combustion characteristics.
Pressure TDC BDC Compression 0 180 360 Crank angle (deg) Stages of Combustion in S.I.Engines Compression a Theoretical pressure crank angle (p-) diagram
Pressure TDC BDC Compression 0 180 360 Crank angle (deg) Stages of Combustion in S.I.Engines Compression a Theoretical pressure crank angle (p-) diagram
Pressure TDC BDC Compression 0 180 360 Crank angle (deg) Stages of Combustion in S.I.Engines Compression a Theoretical pressure crank angle (p-) diagram
Pressure TDC BDC Compression 0 180 360 Crank angle (deg) Stages of Combustion in S.I.Engines b Compression a Theoretical pressure crank angle (p-) diagram
Pressure 0 180 360 Crank angle (deg) Stages of Combustion in S.I.Engines c Combustion b Compression spark a Theoretical pressure crank angle (p-) diagram
Pressure 0 180 360 Crank angle (deg) Stages of Combustion in S.I.Engines c Combustion Expansion b Compression spark a Theoretical pressure crank angle (p-) diagram
Pressure 0 180 360 Crank angle (deg) Stages of Combustion in S.I.Engines c Combustion Expansion b Compression spark a Theoretical pressure crank angle (p-) diagram
Pressure 0 180 360 Crank angle (deg) Stages of Combustion in S.I.Engines c Combustion Expansion b Compression spark d a Theoretical pressure crank angle (p-) diagram
TDC 30 20 10 0 Pressure (bar) BDC Compression 100 80 60 40 20 8 0 20 40 60 80 Crank angle (deg) Actual pressure crank angle (p-) diagram Stages of Combustion in S.I.Engines
TDC 30 20 10 0 Pressure (bar) BDC Compression 100 80 60 40 20 8 0 20 40 60 80 Crank angle (deg) Actual pressure crank angle (p-) diagram Stages of Combustion in S.I.Engines Compression
30 20 10 0 Pressure (bar) 100 80 60 40 20 8 0 20 40 60 80 Crank angle (deg) Actual pressure crank angle (p-) diagram Stages of Combustion in S.I.Engines Spark A Compression and combustion
30 20 10 0 Pressure (bar) 100 80 60 40 20 8 0 20 40 60 80 Crank angle (deg) Actual pressure crank angle (p-) diagram Stages of Combustion in S.I.Engines Spark B Combustion A Compression Motoring and combustion TDC
30 20 10 0 Pressure (bar) 100 80 60 40 20 8 0 20 40 60 80 Crank angle (deg) Actual pressure crank angle (p-) diagram Stages of Combustion in S.I.Engines C Expansion Spark B Combustion A Compression Motoring TDC
30 20 10 0 Pressure (bar) 100 80 60 40 20 8 0 20 40 60 80 Crank angle (deg) Actual pressure crank angle (p-) diagram Stages of Combustion in S.I.Engines C Expansion D Spark B Combustion A Compression Motoring TDC
30 20 10 0 Pressure (bar) 100 80 60 40 20 8 0 20 40 60 80 Crank angle (deg) Actual pressure crank angle (p-) diagram Stages of Combustion in S.I.Engines C Expansion D Spark B Combustion A Compression Motoring TDC
TDC 30 20 10 0 Pressure (bar) BDC Compression 100 80 60 40 20 8 0 20 40 60 80 Crank angle (deg) pressure crank angle (p-) diagram Motoring curve
TDC 30 20 10 0 Pressure (bar) BDC Compression 100 80 60 40 20 8 0 20 40 60 80 Crank angle (deg) pressure crank angle (p-) diagram Motoring curve Compression
30 20 10 0 Pressure (bar) 100 80 60 40 20 8 0 20 40 60 80 Crank angle (deg) pressure crank angle (p-) diagram Motoring curve TDC BDC Compression Compression
30 20 10 0 Pressure (bar) 100 80 60 40 20 8 0 20 40 60 80 Crank angle (deg) pressure crank angle (p-) diagram Motoring curve TDC BDC Compression Compression
30 20 10 0 Pressure (bar) 100 80 60 40 20 8 0 20 40 60 80 Crank angle (deg) pressure crank angle (p-) diagram Motoring curve TDC BDC Compression Expansion Expansion
30 20 10 0 Pressure (bar) 100 80 60 40 20 8 0 20 40 60 80 Crank angle (deg) pressure crank angle (p-) diagram Motoring curve TDC BDC Expansion Compression Expansion
30 20 10 0 Pressure (bar) 100 80 60 40 20 8 0 20 40 60 80 Crank angle (deg) pressure crank angle (p-) diagram Motoring curve TDC BDC Expansion Compression Expansion
I II III C Expansion D Spark 30 20 10 0 Pressure (bar) B Combustion A Compression Motoring TDC 100 80 60 40 20 8 0 20 40 60 80 Crank angle (deg) Actual pressure crank angle (p-) diagram Stages of Combustion in S.I.Engines I Ignition lag II Propagation of flame III After burning
Stages • A to B • B to C • C to D
Flame front propagation The factors which influence the flame front are • Reaction rate • The rate at which the flame eats its way into the unburned charge • Transposition rate • Due to the physical movement of the flame front relative to the cylinder wall • The result of the pressure differential between the burning gases and the unburnt gases in the combustion chamber • Turbulence
100 80 60 40 20 0 Distance of flame travel across the chamber (%) 0 20 40 60 80 100 Time of flame travel across the chamber (%) Flame front propagation B Area I Low transpositionrateLow Turbulence Low reaction rate A
100 80 60 40 20 0 Distance of flame travel across the chamber (%) 0 20 40 60 80 100 Time of flame travel across the chamber (%) Flame front propagation C Area II High transpositionrateHigh Turbulence High reaction rate B Area I Low transpositionrateLow Turbulence Low reaction rate A
100 80 60 40 20 0 Distance of flame travel across the chamber (%) 0 20 40 60 80 100 Time of flame travel across the chamber (%) Flame front propagation Low transpositionrateLow Turbulence Low reaction rate D Area III C Area II High transpositionrateHigh Turbulence High reaction rate B Area I Low transpositionrateLow Turbulence Low reaction rate A
0.006 0.004 0.002 0.000 Stoichiometric mixture Time in seconds 60 100 140 180 220 Lean Equivalence ratio Factors influencing the flame speed • Turbulence • Fuel-air ratio • Temperature and pressure • Compression ratio • Engine output • Engine speed • Engine size A Rich
Rate of Pressure rise Peak pressure Start of pressure rise Rate of pressure rise Indicated by the slope of the curves between start of pressure rise and the peak pressure 30 20 10 0 Pressure (bar) Motoring curve Compression Power 120 80 40 TDC 40 80 120 Crank angle (deg) Illustrations of various Combustion rates
Rate of Pressure rise Peak pressure Start of pressure rise Rate of pressure rise Indicated by the slope of the curves between start of pressure rise and the peak pressure 30 20 10 0 Pressure (bar) Motoring curve Compression Power 120 80 40 TDC 40 80 120 Crank angle (deg) Illustrations of various Combustion rates
Rate of Pressure rise Peak pressure Start of pressure rise Rate of pressure rise Indicated by the slope of the curves between start of pressure rise and the peak pressure 30 20 10 0 Pressure (bar) Motoring curve Compression Power 120 80 40 TDC 40 80 120 Crank angle (deg) Illustrations of various Combustion rates
Rate of Pressure rise High rate-I Peak pressure Normal rate-II Start of pressure rise Rate of pressure rise Indicated by the slope of the curves between start of pressure rise and the peak pressure 30 20 10 0 Low rate-III Pressure (bar) Motoring curve Compression Power 120 80 40 TDC 40 80 120 Crank angle (deg) Illustrations of various Combustion rates