Download
1 / 56
560 likes | 578 Views
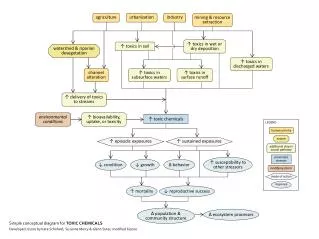
Learn to model dynamic count data over time using Bayesian networks. Explore single and multiple sensor results, future work, event detection, and adaptive event detection methods. Discover the marriage of probability theory and graph theory with Graphical Models.

E N D
Modeling Count Data over Time Using Dynamic Bayesian NetworksJonathan HutchinsAdvisors: Professor Ihler and Professor Smyth
Sensor Measurements Reflect Dynamic Human Activity Optical People Counter at a Building Entrance Loop Sensors on Southern California Freeways
Outline • Introduction, problem description • Probabilistic model • Single sensor results • Multiple sensor modeling • Future Work
Modeling Count Data p(count|λ) count In a Poisson distribution: mean = variance = λ
Simulated Data variance mean people count 15 weeks, 336 time slots
Building Data variance mean people count
Freeway Data variance mean people count
Detecting Unusual Events: Baseline Method Ideal model car count Baseline model car count Unsupervised learning faces a “chicken and egg” dilemma
Persistent Events Notion of Persistence missing from Baseline model
Quantifying Event Popularity Ideal model Baseline model
My contribution Adaptive event detection with time-varying Poisson processes A. Ihler, J. Hutchins, and P. Smyth Proceedings of the 12th ACM SIGKDD Conference (KDD-06), August 2006. • Baseline method, Data sets, Ran experiments • Validation Learning to detect events with Markov-modulated Poisson processes A. Ihler, J. Hutchins, and P. Smyth ACM Transactions on Knowledge Discovery from Data, Dec 2007 • Extended the model to include a second event type (low activity) • Poisson Assumption Testing Modeling Count Data From Multiple Sensors: A Building Occupancy Model J. Hutchins, A. Ihler, and P. Smyth IEEE CAMSAP 2007,Computational Advances in Multi-Sensor Adaptive Processing, December 2007.
Graphical Models "Graphical models are a marriage between probability theory and graph theory. They provide a natural tool for dealing with two problems that occur throughout applied mathematics and engineering -- uncertainty and complexity” Michael Jordan 1998
Directed Graphical Models • Nodes variables hidden Observed Count observed Event Rate Parameter
B A C Directed Graphical Models • Nodes variables • Edges direct dependencies
Graphical Models: Modularity Observed Countt+1 Observed Countt+2 Observed Countt-2 Observed Countt-1 Observed Countt
Graphical Models: Modularity Poisson Rate λ(t) hidden Day, Timet-1 Day, Timet Day, Timet+1 observed Normal Countt-1 Normal Countt-1 Normal Countt-1 Observed Countt+1 Observed Countt-1 Observed Countt
Graphical Models: Modularity Poisson Rate λ(t) hidden Day, Timet-1 Day, Timet Day, Timet+1 observed Normal Countt-1 Normal Countt-1 Normal Countt-1 Observed Countt+1 Observed Countt-1 Observed Countt
Graphical Models: Modularity Poisson Rate λ(t) hidden Day, Timet-1 Day, Timet Day, Timet+1 observed Normal Countt-1 Normal Countt-1 Normal Countt-1 Observed Countt+1 Observed Countt-1 Observed Countt Eventt-1 Eventt Eventt+1
Graphical Models: Modularity Poisson Rate λ(t) hidden Day, Timet-1 Day, Timet Day, Timet+1 observed Normal Countt-1 Normal Countt-1 Normal Countt-1 Observed Countt+1 Observed Countt-1 Observed Countt Eventt-1 Eventt Eventt+1 Event State Transition Matrix
Poisson Rate λ(t) Day, Timet-1 Day, Timet Day, Timet+1 hidden Normal Countt-1 Normal Countt-1 Normal Countt-1 observed Observed Countt-1 Observed Countt Observed Countt+1 Event Countt-1 Event Countt Event Countt+1 Eventt-1 Eventt Eventt+1 Event State Transition Matrix
α Poisson Rate λ(t) Day, Timet-1 Day, Timet Day, Timet+1 hidden Normal Countt-1 Normal Countt-1 Normal Countt-1 observed Observed Countt-1 Observed Countt Observed Countt+1 Event Countt-1 Event Countt Event Countt+1 Eventt-1 Eventt Eventt+1 η η η Event State Transition Matrix β
Poisson Rate λ(t) Day, Timet-1 Day, Timet Day, Timet+1 hidden Normal Countt-1 Normal Countt-1 Normal Countt-1 observed Observed Countt-1 Observed Countt Observed Countt+1 Event Countt-1 Event Countt Event Countt+1 Eventt-1 Eventt Eventt+1 Event State Transition Matrix Markov Modulated Poisson Process (MMPP) model e.g., see Heffes and Lucantoni (1994), Scott (1998)
Gibbs Sampling * * * * * * * * * * * * * * * * * *
Gibbs Sampling * * * * * y * * * x
Gibbs Sampling Poisson Rate λ(t) Day, Timet-1 Day, Timet Day, Timet+1 Normal Countt-1 Normal Countt-1 Normal Countt-1 Observed Countt-1 Observed Countt Observed Countt+1 Event Countt-1 Event Countt Event Countt+1 Eventt-1 Eventt Eventt+1 Event State Transition Matrix
Gibbs Sampling Poisson Rate λ(t) Poisson Rate λ(t) Poisson Rate λ(t) For the ternary valued event variable with chain length of 64,000 Brute force complexity ~ Day, Timet-1 Day, Timet Day, Timet+1 Normal Countt-1 Normal Countt-1 Normal Countt-1 Observed Countt-1 Observed Countt Observed Countt+1 Event Countt-1 Event Countt Event Countt+1 Eventt-1 Eventt Eventt+1 Event State Transition Matrix Event State Transition Matrix Event State Transition Matrix
Gibbs Sampling Poisson Rate λ(t) Poisson Rate λ(t) Day, Timet-1 Day, Timet-1 Observed Countt-1 Observed Countt-1 Poisson Rate λ(t) Event Countt-1 Event Countt-1 Day, Timet-1 Normal Countt-1 Normal Countt-1 Observed Countt-1 Event Countt-1 Normal Countt-1 Eventt-1 Eventt Eventt+1 A A A
Chicken/Egg Delima car count car count
Event Popularity car count car count
Persistent Event Notion of Persistence missing from Baseline model
Detecting Real Events: Baseball Games Remember: the model training is completely unsupervised, no ground truth is given to the model
Multi-sensor Occupancy Model Modeling Count Data From Multiple Sensors: A Building Occupancy Model J. Hutchins, A. Ihler, and P. Smyth IEEE CAMSAP 2007,Computational Advances in Multi-Sensor Adaptive Processing, December 2007
Where are the People? Building Level City Level
Sensor Measurements Reflect Dynamic Human Activity Optical People Counter at a Building Entrance Loop Sensors on Southern California Freeways
Application: Multi-sensor Occupancy Model CalIt2 Building, UC Irvine campus
Building Occupancy, Raw Measurements Occt = Occt-1 + inCountst-1,t – outCountst-1,t
Over-counting Building Occupancy: Raw Measurements Under-counting Noisy sensors make raw measurements of little value
Adding Noise Model Poisson Rate λ(t) Day, Timet-1 Day, Timet Normal Countt-1 Normal Countt-1 True Countt-1 Observed Countt-1 True Countt Observed Countt Event Countt-1 Event Countt Eventt-1 Eventt Event State Transition Matrix
Probabilistic Occupancy Model Time t Time t+1 Constraint Time Occupancy Occupancy Out(Exit) Sensors Out(Exit) Sensors In(Entrance) Sensors In(Entrance) Sensors
24 hour constraint Geometric Distribution, p=0.5 Constraint Occupancy Building Occupancy 47
Learning and Inference Gibbs Sampling | Forward-Backward | Complexity Occupancy Occupancy Out(Exit) Sensors Out(Exit) Sensors In(Entrance) Sensors In(Entrance) Sensors
Typical Days Building Occupancy Thursday Friday Saturday
Missing Data Building Occupancy time