Download
1 / 17
230 likes | 536 Views
Cumulative Frequency Diagrams. The following frequency table shows the heights of a group of students in centimetres:. Cumulative Frequency Diagrams. The following frequency table shows the heights of a group of students in centimetres:. Cumulative Frequency Diagrams.

E N D
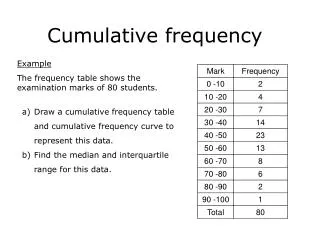
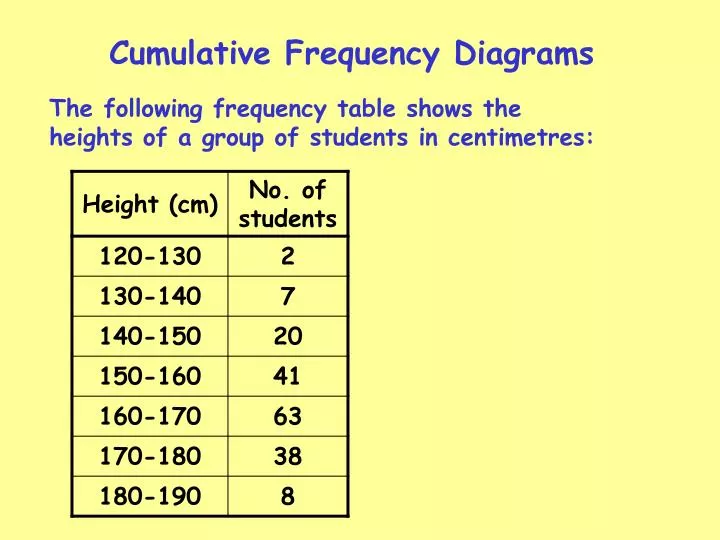
Cumulative Frequency Diagrams The following frequency table shows the heights of a group of students in centimetres:
Cumulative Frequency Diagrams The following frequency table shows the heights of a group of students in centimetres:
Cumulative Frequency Diagrams The following frequency table shows the heights of a group of students in centimetres:
Cumulative Frequency Diagrams The following frequency table shows the heights of a group of students in centimetres:
Cumulative Frequency Diagrams The following frequency table shows the heights of a group of students in centimetres:
Cumulative Frequency Diagrams The following frequency table shows the heights of a group of students in centimetres:
Cumulative Frequency Diagrams The following frequency table shows the heights of a group of students in centimetres:
Cumulative Frequency Diagrams The following frequency table shows the heights of a group of students in centimetres:
The median is the 90th value The median is about 163 cm
The lower quartile is the 45th value The lower quartile is about 155 cm
The upper quartile is the 135th value The upper quartile is about 170 cm
The Interquartile Range = upper quartile — lower quartile = 170 — 155 = 15 cm