Download
1 / 16
290 likes | 745 Views
Highlighting the use of GIS in Climate Change Studies. Mr. Nikolai Thomas. HIGHLIGHTING THE USE OF GIS IN CLIMATE CHANGE. UWI CLIMATE CHANGE JUNE, 2007. Overview of presentation. What is GIS Associated tools Remote Sensing Global Positioning System Web publishing of maps/data

E N D
Highlighting the use of GIS in Climate Change Studies Mr. Nikolai Thomas
HIGHLIGHTING THE USE OF GIS IN CLIMATE CHANGE UWI CLIMATE CHANGE JUNE, 2007
Overview of presentation • What is GIS • Associated tools • Remote Sensing • Global Positioning System • Web publishing of maps/data • Application at ODPEM
What is GIS? Geographic Information Systems (GIS) is a spatial database management system that can analyze, query and display data using digitized maps and tables for planning and decision-making (Anonymous)
Remote Sensing Remote sensing is the short or large-scale acquisition of information of an object or phenomenon, by the use of either recording or real-time sensing device(s) that is not in physical or intimate contact with the object (such as aircrafts, satellites).
Remote Sensing allows for: • Image interpretation & classification • Time-series image analysis • Drought analysis • Tracking of hurricanes
Global Positioning System GPS is a satellite navigation system used to determine ground position (coordinates) a worldwide satellite navigational system formed by 24 satellites orbiting the earth and their corresponding receivers on the earth.
GPS devices allows you to: • Gather accurate spatial data • Flood extent • Sea level rise • Storm surge runup • Heights above sea level
WEB PUBLISHING Web delivery of geographic data and maps. Allows you to: • Publish high-quality interactive maps that can be accessed by thousands of people simultaneously over the Internet. • Integrate data from multiple sources (Internet or local) and serve it on the Web.
GIS allows for: • Data capture • Data integration • Analysis • Projection • Data modeling • Display • Attribute table which forms a database
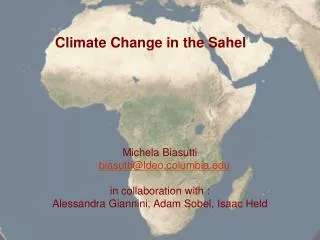
Possible effects of Climate change in the Caribbean • Sea level rise • Increased saline intrusion of groundwater • Expansion of wetlands • Loss of beach • Damage to coastal infrastructure • Increased severity of floods • Increase in the number and severity of hurricanes • 2005 Hurricane Season
Application at ODPEM • JAHGIS • Create and Manage associated Database • Remote Sensing • NASA Whirlwind (Servir) • Hurrevac • UN Space Charter • Data Analysis • Vulnerability Assessment
Application at ODPEM • Collect damage assessment data • Storm surge run up • Flood area • Data Modelling • Preparation of Hazard Maps • Landslide and Flooding susceptibility
Application at ODPEM • Map preparation • Portmore Evacuation Map • Publishing of spatial data over the web • Collaboration with the Ministry of Agriculture
THE END “GIS SAVES LIVES”