Download
1 / 102
1.32k likes | 2.1k Views
indoor localization Using fingerprinting. Dimitrios Lymberopoulos - Microsoft Research. Infrastructure is already in place. Home. Mall. Restaurant. Coffee Shop. The Problem. Estimating distance from Received Signal Strength (RSSI) is hard Path loss propagation model.

E N D
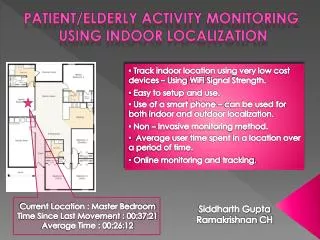
indoor localization Using fingerprinting Dimitrios Lymberopoulos - Microsoft Research
Infrastructure is already in place Home Mall Restaurant Coffee Shop
The Problem • Estimating distance from Received Signal Strength (RSSI) is hard • Path loss propagation model distance between TX and RX + X Flat Fading Reference distance between TX and RX Path Loss (dBm) Path Loss at reference distance (dBm) Path Loss Exponent (2 - 4) • Realistic indoor environments introduce significant noise • Multipath fading • Signal occlusions due to objects/walls • Signal diffractions depending on the object’s material
The Problem [Bahl2000]
Fingerprint-based Indoor Localization • Key idea: • Map signal strengths to physical locations (Radio Fingerprinting) • Inputs: • Signal strength of access point beacons • Building geometry/map • Offline phase: Construct a Radio Map • <Location, RSSI> information • Online phase: • Extract RSSI from base station beacons • Find Radio Map entry that best matches the measured RSSI values
Outline What’s Next? Magnetic Field WiFi Sound GSM FM
RADAR – Offline Phase • For every location, and for every user orientation at this location: • < <x,y,z>, <RSSIA, RSSIB, RSSIC> > • RSSI values averaged over multiple measurements to capture • Stochastic variations of wireless signals • The effect of user orientation RSSI Map • < <x,y,z>, <A:10, B:20, C:15> > • < <x,y,z>, <A:12, B:19, C:15> > … • < <x’,y’,z’>, <A:0, B:30, C:40> > A C B [Bahl2000]
RADAR – Online Phase • At the unknown location, record all RSSI values: • < RSSIA, RSSIB, RSSIC > = < A:11, B:20, C:13 > • The location of the closest fingerprint in the RSSI Map becomes the location of the user: <x,y,z> RSSI Map • < <x,y,z>, <A:10, B:20, C:15> > • < <x,y,z>, <A:12, B:19, C:15> > … • < <x’,y’,z’>, <A:0, B:30, C:40> > A C B Closest fingerprint – User Location: <x,y,z> [Bahl2000]
RADAR DEMO
RADAR – Performance • 3-story office building • 43.5m x 22.5m • 3 Access points Median Error: 2.94 meters 90% Error: 10 meters [Bahl2000]
RADAR – Neighbor Averaging N1 N1, N2, N3: neighbors T: true location of user G: guess based on averaging T G N3 N2 Median Error Distance when averaging over 3 neighbors: 2.13 meters [Bahl2000]
Radar - Overview • Introduced WiFi fingerprinting • Median error of 2.1 meters • 90% within 10 meters • Limitations • Profiling effort • For each location multiple measurements for each user orientation • Accuracy is good, but not ideal • Performance • What if the RSSI map is large?
Probabilistic Fingerprinting • RADAR leverages deterministic fingerprinting • Averaging RSSI values over multiple measurements at a given location to create radio map • Fails to accurately capture wireless channel characteristics • Temporal variations and correlations • Spatial variations • Probabilistic Fingerprinting • Accurately capture signal variations during the radio map creation • Leverage probabilistic techniques (i.e., Bayesian models) for fingerprint matching
Horus: Main Idea • Offline Fingerprinting • Store distributions of RSSI values for a given location in the RSSI map (parametric or non-parametric) • For location x, we store: P(RSSI|x) • Online Fingerprinting • Record a new distribution of RSSI values • Identify location x from the RSSI map that satisfies: • P(RSSI|x) can be calculated directly from the radio map
Horus: Architecture [Youssef2005]
Horus: Offline • Group together all points covered by the same set of access points • Performance • Enable faster fingerprint matching during the online phase [Youssef2005]
Horus: Offline • Builds the radio map • Distribution of RSSI values • Accounts for temporal variations of RSSI values • Autoregressive model [Youssef2005]
Horus: Offline • Estimate the value of in the autoregressive model • Estimate the parameters of the RSSI distribution • Gaussian distribution [Youssef2005]
Horus: Online • Average consecutive N RSSI values [Youssef2005]
Horus: Online • Returns the radio map location closest to the recorded fingerprint [Youssef2005]
Horus: Online • Perturbs the RSSI value from each access point in the online fingerprint, and then re-estimates the location • Chooses the closest to the initially estimated location • Continuous Location Sensing • Averaging of top candidate locations • Time-averaging in the physical space [Youssef2005]
Horus: Evaluation • 110 locations along the corridor and 62 locations inside rooms. • 21 access points • Fingerprinting at 1.52m resolution [Youssef2005]
Horus: Evaluation 90th percentile error: 1.5 meters [Youssef2005]
Horus • Probabilistic Fingerprinting • Properly model the stochastic variation of WiFi signals at the fingerprinting stage • Parametric or non-parametric distributions • Clutering of locations to improve performance • 90% Error • Horus: 1.5m • RADAR: 10m
What if accuracy <1m is required? • Am I looking at the toothpaste or the shampoo shelf? • RSSI only changes over several meters • Fundamentally limits localization accuracy • Exploit the physical layer! • Beyond RSSI values • More fine-grain information used for fingerprinting • Hopefully more unique, and therefore more accurate!
PinLoc: Fingerprinting Wireless Channel • 802.11 a/g/n implements OFDM • Wideband channel divided into subcarriers 1 2 3 4 5 6 7 8 9 10 39 48 Frequency subcarriers • Intel 5300 card exports frequency response per subcarrier [Sen2012]
Spatial • Channel responses at different locations need to be different Temporal • Channel responses at a given location may vary over time • However, variations must exhibit a pattern – a signature 2. 1. Two Key Hypotheses Need to Hold [Sen2012]
cluster2 cluster2 Variation over Time • Measured channel response at different times [Sen2012]
Unique clusters per location How Many Clusters per Location? Others 4th 3rd 2nd most Most frequent cluster [Sen2012]
Cross correlation with signature at reference location Localization Granularity 3 cm apart 2 cm apart Channel response changes every 2-3cm Define “location” as 2cm x 2cm area, call them pixels [Sen2012]
Pixel Signature Variation > Max () Cross Similarity Self Similarity Pixel 1 Pixel 2 Pixel 3 Im (H(f)) Real (H(f)) [Sen2012]
For correct pixel localization: > Max () Cross Similarity 0 - Self Similarity AP1 AP2 AP1 and AP2 Self – Max (Cross) Self – Max (Cross) Self – Max (Cross) 67% pixel accuracy with multiple APs [Sen2012]
Group Pixels into Spots 2cm Pixel Spot Intuition: low probability that a set of pixels will all match well with an incorrect spot [Sen2012]
PinLoc Evaluation • Evaluated PinLoc (with existing building WiFi) at: • Duke museum • ECE building • Café (during lunch) • Roomba calibrates • 4 min each spot • Testing next day • Compare with Horus (best RSSI based scheme) [Sen2012]
Accuracy per spot Performance Horus PinLoc • 90% mean accuracy, 6% false positives • WiFi RSSI is not rich enough, performs poorly - 20% accuracy [Sen2012]
PinLoc: Fingerprinting Wireless Channel • Leverage physical layer information for fingerprinting • Fine-grain fingrprinting • Predictable temporal variations • Highly accurate localization • <1 meters accuracy! • Extensive profiling is required!
WiFi Limitations Reasonable Accuracy Low Cost Sensitive to human presence Commercial APs Variation over Time Blind Spots
FM Signals • Occupy 87.8-108MHz, a total of 20.2MHz and 101 channels Low power receivers in most phones Existing Infrastructure (FM Radio Towers) More robust to human presence/orientation Excellent indoor penetration
FM stations as WiFi Access Points • Use additional physical layer information to enable more robust fingerprints • The way signals are reflected is unique to the given location, and multipath indicators can capture this. [Chen2012]
FM Towers are Sparse [Chen2012]
Experimental Study • Silicon Labs SI-4735 Receiver • Leading manufacturer of FM receivers • Access to low level physical information • RSSI • Signal to noise ratio indicator (SNR) • Multipath indicator • Frequency Offset indicator • Data Collected • WiFi RSSI values • 32 FM radio stations MS Office building (3 Floors, 119 rooms) [Chen2012]
Localization Method & Accuracy • Room level localization (room size: 9ft x 9ft) • Multiple measurements per room at different locations • 65% train, 35% test • Localization result: the nearest neighbor (Manhattan distance) in signature space [Chen2012]
Fingerprint Distance Matrices WiFi RSSI FM RSSI [Chen2012] FM ALL FM ALL + WiFi RSSI
Localization Method & Accuracy • Room level localization • Multiple measurements per room at different locations • 65% train, 35% test • Localization result: the nearest neighbor (Manhattan distance) in signature space [Chen2012]
Localization Method & Accuracy • Temporal variation • 4 additional datasets were collected (days, weeks, months apart) • Train:1 dataset , Test: the rest 4 datasets • Average accuracy reported across all possible train/test combinations. [Chen2012]
Localization Method & Accuracy • Temporal variation & larger training set • Train: 4 datasets , Test: the remaining 1 dataset • Average accuracy reported across all possible train/test combinations. [Chen2012]
Is 32 the magic number? [Chen2012]
FM Localization • FM-based indoor localization • Similar or better room-level accuracy compared to WiFi • FM signals exhibit less temporal variations to WiFi signals • The use of additional signal indicators at the physical layer can improve localization accuracy by 5%. • Errors of FM and WiFi signals are independent • Combining FM and WiFi signatures provides the highest localization accuracy • >80% improvement when considering temporal variations