Download
1 / 19
190 likes | 216 Views
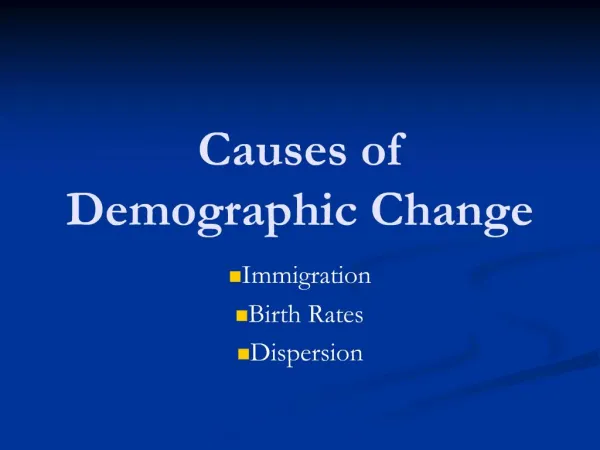
Explore the demographic evolution of Minnesota from 1880 to 2025, analyzing population growth, sex ratio, race, marital status, fertility rates, life expectancy, and age of marriage. Data sources include IPUMS and Minnesota State Demographic Center.

E N D
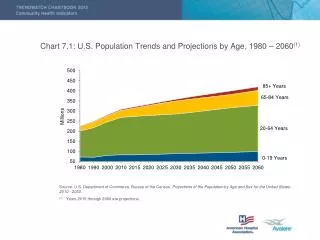
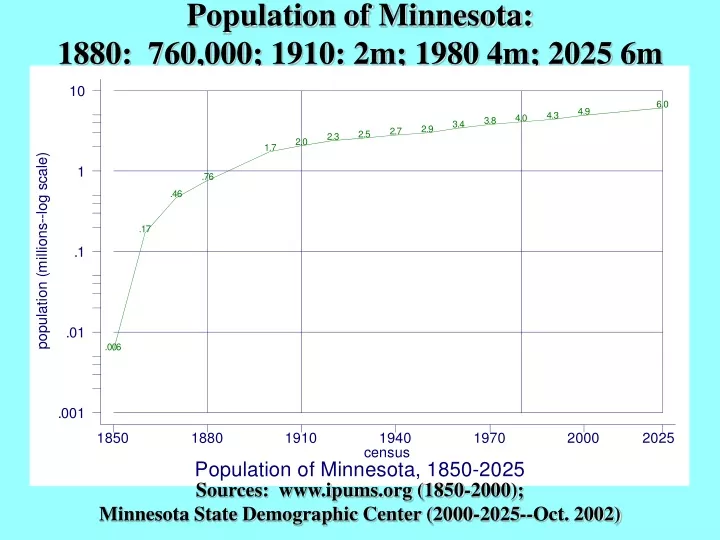
Population of Minnesota: 1880: 760,000; 1910: 2m; 1980 4m; 2025 6m Sources: www.ipums.org (1850-2000); Minnesota State Demographic Center (2000-2025--Oct. 2002)
1860-1880 = 4x; 1880-1910 = 2x; 1910-80 = 2x Sources: www.ipums.org (1850-2000); Minnesota State Demographic Center (2000-2025--Oct. 2002)
“Frontier” Sex-Ratio 1940 Source: www.ipums.org (1850-2000)
“Race” in Minnesota Source: www.ipums.org (1850-2000)
Place of Birth MN native born foreign born native prnts
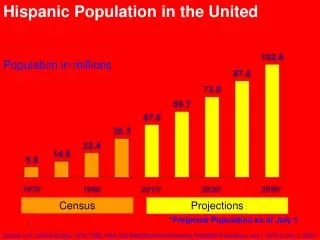
Hispanic origin Source: www.ipums.org (1850-2000)
Marital Status(confounded by age) Source: www.ipums.org (1850-2000)
Fewer individuals living as kin & unrelatedsMore heads, spouses, fewer children Source: www.ipums.org (1850-2000)
Fertility • Year cbr tfr • 1927 20.2 • 1932 17.9 • 1940 19.0 • 1951 26.6 • 1960 25.7 • 1970 17.6 • 1980 16.6 2.3 • 1990 15.5 2.3 • 2000 13.7
Life expectancy (both sexes) • 1940 65.6 years • 1950 69.3 • 1960 71.8 • 1970 75.0 • 1980 76.2 • 1990 77.8 • 2000 79.1
singulate mean age of marriage (SMAM)Minnesota • Male • 1880 28.8 • 1900 29.5 • 1910 29.9 • 1920 28.0 • 1940 26.2 • 1950 24.8 • 1960 23.4 • 1970 23.5 • 1980 25.4 • 1990 27.7 • 2000 28.2 • Female • 1880 23.3 • 1900 25.1 • 1910 26.0 • 1920 24.8 • 1940 24.0 • 1950 21.4 • 1960 21.2 • 1970 22.1 • 1980 23.9 • 1990 26.0 • 2000 26.5