Download
1 / 24
240 likes | 406 Views
Flash Flood Climatology for the Goodland County Warning Area. 13 th High Plains Conference August 27, 2009. Flash Flood Data. Period of Record (1994-2007) 141 Events (Approximately 11 per year) 78 Flash Flood Days (Approximately 6 per year). Monthly Climatology. 71% occur in JJA.

E N D
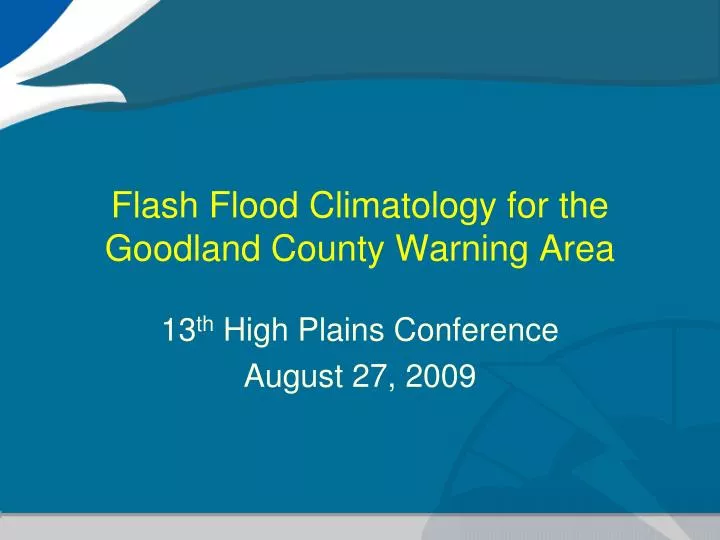
Flash Flood Climatology for the Goodland County Warning Area 13th High Plains Conference August 27, 2009
Flash Flood Data • Period of Record (1994-2007) • 141 Events (Approximately 11 per year) • 78 Flash Flood Days (Approximately 6 per year)
Monthly Climatology 71% occur in JJA
Diurnal Climatology 81% occur between 3 PM and Midnight LST
Maddox Distribution 886% are Maddox Type I or Type II
General facts from the Maddox Study • Events were characterized based on the 500 mb pattern. • In general, flash flood events occurred in weak large scale patterns and without well defined/weak surface features. • Maximum occurrence was in July and August, and had a strong link with the southwest monsoon season. • Most flash floods were produced by rainfalls of 2 inches to less than 4 inches.
TYPE I • Weak short-wave trough moving northward up the western side of a long-wave ridge. • Very moist conditions extend up to 300 mb • Flow is southerly through 200 mb, and is light (less than 40 knots) at all levels. • K index ~40 and LI ~ -4 with PWAT values 184% of the monthly average. • Example of a TYPE I event was the Big Thompson Canyon flash flood from July 1976. • In Maddox’s research, this type included the largest number of events, nearly 50%.
TYPE II • 500 mb short-wave trough moving southward down the eastern side of a long-wave ridge. • Winds aloft were westerly with speeds still less than 40 knots at all levels. • Moist air mass extends up to 300 mb with PWATs of 145% of normal. • KI ~ 39 and LI ~ -5 • This type accounted for 20% of the events studied by Maddox.
TYPE III • These were strong synoptic systems which were in contrast to the first two types. • The heavy rains usually covered large areas, and affected locations in the far west and southwest portions of the country. • Exception to this was during the late spring, intense systems that cut off over the Great Basin may pull moist/unstable air upslope into the foothills of the Rocky Mountains.
TYPE III • Temperatures are cooler with much stronger winds that veer with height, and increase to more than 80 knots at 200 mb. • PWATs were 159% of normal with KI ~ 27 and LI ~ +1.
Percent of NormalPrecipitable Water Median is 131% of normal
Storm Motion Climatology 55% between 6 and 15 KT
Synoptic Boundaries Cold front in area 46% of time - some sort of boundary present 92% of time
III IV I II V Surface Low Position Regions
III IV I II V Surface Low Positions
Surface Low Position 58% of events occurred with surface low near the Texas Panhandle.
Significant Rainfall • As a part of going through all of this flash flood data, Scott ran through some rainfall statistics. • From COOP sites in our area, he collected all reports of rain from 1994 to 2007 during March through September. • There were about 250,000 reports of rain. • Using three standard deviations as denotingstatistical significance, rainfall reports over 1.68 inches in 24 hours were considered significant events. • If a station receives over that amount, you were in "significant" territory. Only 2% of the events qualify.
Summary • Flash Flood Events Mainly Occur • In the summer • In the late afternoon and evening • With storm motion speeds between 6 and 15 knots • With a synoptic boundary in the area • With a surface low near the Texas Panhandle • With precipitable water values between 125 and 150% of normal • With a Theta/e axis over or near the area • In a Maddox Type I or Type II regime
Future Work • Antecedent precipitation will be looked at prior to flash flood events.