Download
1 / 68
680 likes | 830 Views
Results of the 2012 Lee County Community Survey. Board Presentation, 5-15-2012. Introduction. Gibson Consulting Group, Inc . Provide research and consulting services exclusively in the education sector

E N D
Results of the 2012 Lee County Community Survey Board Presentation, 5-15-2012
Introduction • Gibson Consulting Group, Inc. • Provide research and consulting services exclusively in the education sector • Survey research, program evaluation, efficiency analysis, performance-based budgeting, technology consulting, decision support, financial reviews • Experience with over 250 school systems in 15 states over the past 20 years
Lee County Project Team • Amie Rapaport, Ph.D. – Project Director • Greg Gibson, President and Advisor • Project Team • Cheyanne Rolf • Elissa Yeates • Marshall Garland • Ali Taylan
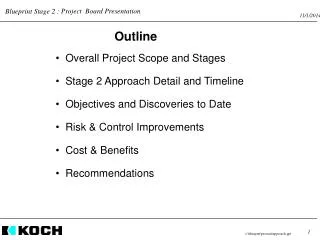
Presentation Outline • Purpose and goals • Survey development • Administration methods • Results • Questions
Project Purpose and Goals • To obtain community input that will inform the District’s decision making • Four key questions:
Question 1 What are the community’s values regarding the importance of different elements of school assignment systems?
Question 2 How well is the District teaching students skills that will prepare them and make them competitive for college and for 21st Century careers?
Question 3 Which types of programs, including language offerings, would attract parents to particular schools?
Question 4 How well is the District fostering parent involvement, and what more can be done to increase parents’ involvement in their child’s education?
Presentation Outline • Purpose and goals • Survey development • Administration methods • Results • Questions
Survey Development • Adult Survey and Student Survey • Methods of school assignment • Students’ college and career readiness • Specific program offerings • Parent involvement
Survey Development • Methods of school assignment • Commonly perceived advantages to each system
Survey Development • Methods of school assignment • How important you think it is that… (1=Not Important, 4 = Extremely Important) • Adults: Responded separately for elementary and secondary levels • Students: Responded only generally • Both: 3 MOST important and 3 LEAST important
Survey Development • Students’ college and career readiness • Partnership for 21st Century Skills: Framework for 21st Century Learning
Survey Development • Students’ college and career readiness • Included 14 areas from P21 • Added two others: • Preparation for applied technical careers • Preparation for four-year colleges • How Lee County schools are doing (1 = Not Well, 4 = Extremely Well)
Survey Development • Students’ college and career readiness
Survey Development • Specific Program Offerings • Career and Technical Academies • Select 5 that are important to have • School-Level Programs • Select 3 you would want a school to have • Languages • Which 1 language should a student be able to study
Survey Development • Parent Involvement • 1 closed-ended question, 1 open-ended question • Closed ended (Adults only) • Lee County schools provide sufficient opportunities for parents/guardians to get involved (1 = Strongly Disagree, 4 = Strongly Agree) • Open-ended (both Adults and Students) • What things can Lee County do to help parents/ guardians be part of their child’s education
Survey Development • Demographics • Adults • Students
Presentation Outline • Purpose and goals • Survey development • Administration methods • Results • Questions
Administration Methods • Adult Survey • Survey window February 1 – February 29, 2012 • Online and hard copy formats • English, Spanish, and Haitian Creole • Multiple methods employed
Administration Methods • Adult Survey • Hard copy dissemination • 20,000 through public and charter main offices • 15,000 through local newspaper subscriptions • 6,000 sent home with interim grades or otherwise sent with students • 5,500 through community organizations (e.g., churches, homeless shelters, United Way, religious organizations, District’s Parent Assistance Center) • 1,500 through Public Library System • 10,000 other-language as needed
Administration Methods • Adult Survey • Flyers, Email (directing to leecountyvoice.com) • 100,000 flyers through utility companies • 5,000 flyers sent home with students • District online newsletter • Email sent to: • Parents with email on file • District staff • Business contacts through four Chambers of Commerce • Lee County Education Foundation contacts • City of Sanibel residents email list
Administration Methods • Adult Survey • Other • Parent Link • Link posted on school websites • Press releases • Information cards through DAC • Five digit text code
Administration Methods • Student Survey • Sampling framework • All secondary schools • One grade in middle, two grades in high • Total sample identified = 16,802 students • 40% middle, 60% high (secondary target sample) • 43% middle, 57% high (secondary population) • Hard copy only • Administered in schools/classrooms to students identified by the research team
Presentation Outline • Purpose and goals • Survey development • Administration methods • Results • Questions
Results – Response Counts • Adult Survey • 10,164 submitted responses • 219 contained too much missing data • 1 did not live in Lee County • 11 were under 18 • 115 were potentially duplicative • Total analytic sample = 9,818 • Statistical reliability: • 99% Confidence Interval, 1.3% margin of error • If repeated 100 times would get same results 99 times
Results – Respondent Counts • Student Survey • 13,296 submitted responses (79% response rate) • 434 completed by students in non-targeted grades • 22 answered only demographic questions • Total analytic sample = 12,840 • Statistical reliability: • 99% Confidence Interval, <1% margin of error • If repeated 100 times would get same results 99 times
Results – Respondent Demogs • Respondent Demographics • Adult Respondents • 98% live in Lee County year round • Almost half have lived in Lee County for > 15 years • Two-thirds were parents of school-age children (86% of these had a child in a Lee County school) • 77% women • One-third were District staff • 14% business owners or executives
Results – Respondent Demogs • Respondent Demographics • Adult Respondents • Race/Ethnicity, income, and age proportionate to population Lee County Median Income: $50,000 Sample: 44% < $50,000 56% > $50,000 • Lee County Median Age: • 46 • Sample: • Average = 45 • 80% between 31 and 60
Results – Respondent Demogs • Respondent Demographics • Student Respondents • 93% have lived in Lee County for > 1 year • Half male, half female • 44% middle school, 56% high school • Every school serving secondary students represented (no one school accounted for >6% of responses)
Results – Respondent Demogs • Respondent Demographics • Student Respondents • Race/Ethnicity proportionate to District secondary population
Results – School Assignment • Student Results • Choice advantages more important
Results – School Assignment • Adult Results – Overall
Results – School Assignment • Adult Results – Elementary • All adults agree that students staying in same school for all grades is one of the most important • For second and third most important issues:
Results – School Assignment • Adult Results – Elementary DATA VISUALIZATION
Results – School Assignment • Adult Results – Secondary
Results – School Assignment • Adult Results – Secondary • These results were consistent for almost all subgroups
Results – School Assignment • Adult Results • Least important, consistently: • Going to school with students from different backgrounds • Attending schools outside of one’s neighborhood • Students being able to change schools
Results – School Assignment • Differences between adults and students
Results – Preparedness for College… • Adult and Student Results • Overall ratings were positive • Reading/ELA most positive • Foreign language instruction consistently negative • Few scores above 3.0 out of 4.0 • Students rated technology instruction less favorably than adults
Results – Preparedness for College… Students
Results – Preparedness for College… • Differences by subgroup • Overall order of ratings essentially the same • Systematic differences:
Results – Programs and Services • Career and Technical Academies • School-level programs • Languages
Results – Programs and Services • Career and Technical Academies • 98% of adults and 95% of students interested in at least one academy • Adults: • Health Science • Business, Management and Administration • Information Technology • Students: • Medical/Sports Medicine • Law, Public Safety, Security • Other • Mostly Fine and Performing Arts
Results – Programs and Services • Career and Technical Academies • Many differences by subgroup • Gender differences (particularly among students) • Ethnicity • Parent status • Income DATA VISUALIZATION
Results – Programs and Services • School-level programs • Adults • STEM-Focused curriculum (72%) • Classes for the Fine and Performing Arts (57%) • Technology-focused instruction (57%) • Students • Technology-focused instruction (74%) • Classes for the Fine and Performing Arts (58%) • STEM-Focused curriculum (46%)
Results – Programs and Services • School-level programs • Greatest consensus regarding need for STEM • 86% of respondents 71 and older • 79% of highest income respondents • Greater interest in Technology-focused instruction among • Highest income group (64%) • 50 years and above (second most desired) • Among students • Boys interested in Technology and STEM • Girls interested in Fine and Performing Arts
Results – Programs and Services • Languages (other than Spanish, French and German)