Download
1 / 2
20 likes | 152 Views
*. BIS- Mid. BSP primers. BIS-5 ’. BIS-3 ’. I-I1-2 RU. 60%. 59%. 67%. C-I2-5 RU. 71%. 66%. 55%. G-I-5 RU. 68%. SD6-6 RU. 73%. BA6-6 RU. D4Z4. hhspm3. DUX4. LSau. 82%. A. F-I3-7 RU. 68%. A-II1-7 RU. 67%. 68%. 71%. B-I1-8 RU. 78%. O-I3-10 RU. 64%. 76%. 65%.

E N D
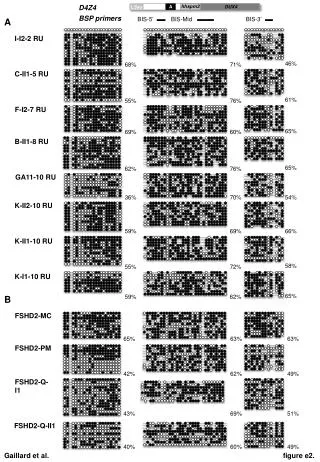
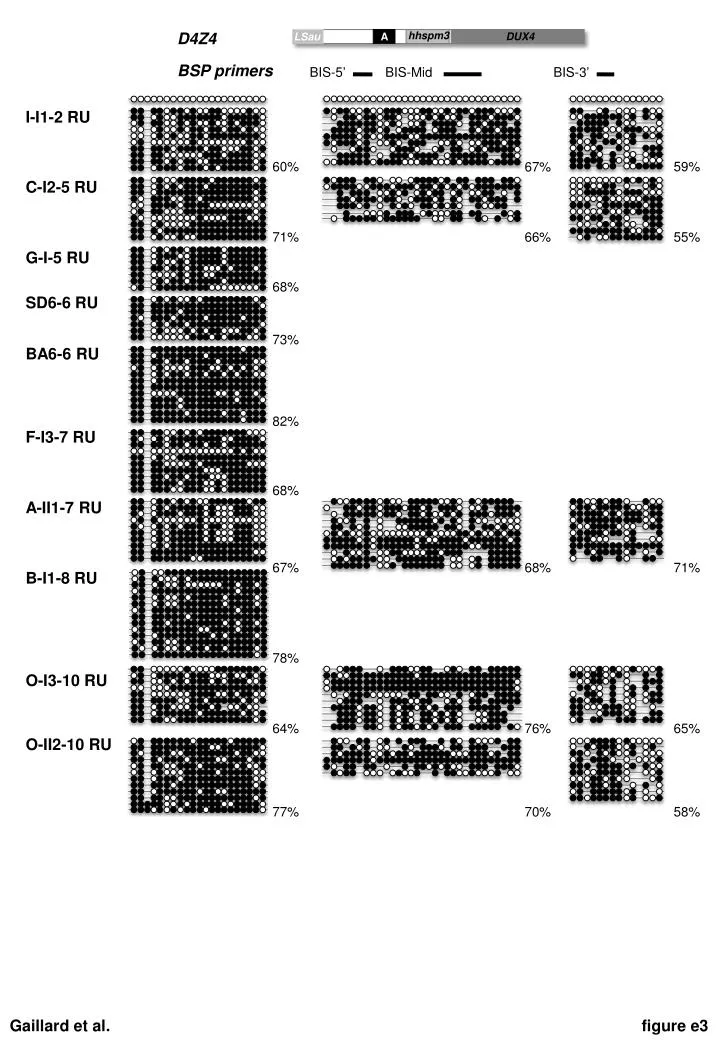
* BIS-Mid BSP primers BIS-5’ BIS-3’ I-I1-2 RU 60% 59% 67% C-I2-5 RU 71% 66% 55% G-I-5 RU 68% SD6-6 RU 73% BA6-6 RU D4Z4 hhspm3 DUX4 LSau 82% A F-I3-7 RU 68% A-II1-7 RU 67% 68% 71% B-I1-8 RU 78% O-I3-10 RU 64% 76% 65% O-II2-10 RU 77% 70% 58% Gaillard et al. figure e3
Figure e-3: Sodium bisulfite sequencing in asymptomatic carriers not clinically affected with FSHD. For asymptomatic carriers (AS-carriers), 10 samples were investigated. For 5 of them, only the 5’ region was analyzed. The number of repeat is indicated for each sample. The position of the three different regions analyzed within D4Z4 is indicated above the corresponding column (from left to right, BIS-5’; BIS-Mid; BIS-3’). Each row of dots corresponds to a cloned DNA molecule. Black dots correspond to methylated CpG, white dots to unmethylatedCpGs and absence of dot represents sequence variation compared to the reference sequence. The percentage of methylated CpG among all CpGsanalyzed/individual is given below each sample.