Download
1 / 51
510 likes | 626 Views
Renewables : Where to?. Adnan Badran Arab Academy of Science Beirut Dec. 7, 2012. Present Energy Resources. Fossil fuels - coal, oil, not sustainable-depleting resources. Nuclear fuels -limited amounts of uranium for nuclear fission reactors but reprocessing of fuel possible.

E N D
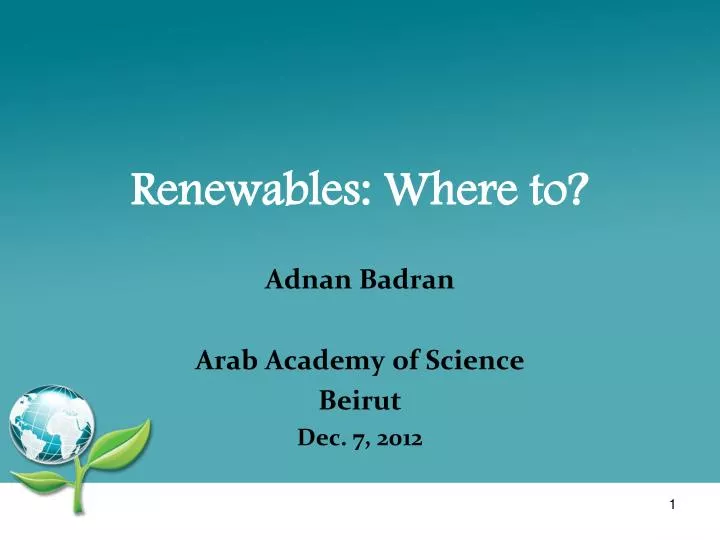
Renewables: Where to? Adnan Badran Arab Academy of Science Beirut Dec. 7, 2012
Present Energy Resources • Fossil fuels - coal, oil, not sustainable-depleting resources. • Nuclear fuels -limited amounts of uranium for nuclear fission reactors but reprocessing of fuel possible.
What renewables Unlikehydrocarbonenergies, renewableenergyisdevelopedfromresourcesthat are constantlyreplenished and willneverrunout. • Solar power • Windpower • Biomasspower • Geothermalenergy • Oceanenergy • Hydropower
Solar Power A Solar power plant the size of lake Nasser has the capacity of supplying the electricity needs of entire region Source: http://www.middleeastelectricity.com
Gigawatt-hours Solar PV Generation Capacity Solar power generating capacity grew by 73.3% in 2011, the fastest growth in our data (which goes back to 1996). Total capacity grew by 29.3 GW to reach 63.4 GW. Capacity has grown almost ten-fold over the past 5 years. Source: http://www.middleeastelectricity.com
Solar capacity growth in 2011 was dominated by two countries, Italy (9.3 GW added) and Germany (7.5 GW). Together they accounted for 57.1% of global capacity growth in 2011. Germany remains the leader for cumulative installed capacity (24.8 GW), and Italy (12.8 GW) has leapt into second place ahead of Japan (4.9 GW). China, already the leading manufacturer of solar PV, has started to develop its domestic solar market, adding 2.2 GW in 2011. China completed a 200 MW solar PV plant, which was at the time the world’s largest solar PV plant. Solar power generation enjoyed spectacular growth in 2011, with a record 86.3% increase. Its overall share of renewable power remains low (6.5%), but 2011 marked the arrival of solar power at scale, contributing 20% of the growth of renewable power in 2011. Solar Power Source: http://www.bp.com/sectiongenericarticle
Arab renewable energy targets Source: AFED, 2011
Energy subsidies in selected Arab countries Source: AFED, 2011
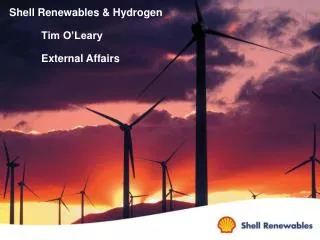
Wind power generating capacity grew by 20.5% in 2011, with capacity increasing by a record 40.8 GW to reach 239 GW by the end of 2011. The trend rate of capacity growth over the past 10 years is just over 25% pa, which implies a doubling of capacity every three years. Wind power now generates 437 TWh of electricity, around 2% of total electricity generation. China remains the largest market for wind power, both in terms of capacity added (17.6 GW) and in terms of cumulative installed capacity (62.4 GW). The second largest market, the US, added 6.8 GW in 2011 to reach 47.1 GW installed capacity. Led by Germany and Spain, Europe remains the largest regional market for wind power in terms of total installed capacity (96.8 GW, or 44% of the world total). The fastest growing region over the past five years has been Asia-Pacific, led by China and India. Asia-Pacific’s share of installed wind capacity has doubled since 2007, reaching 36% by the end of 2011. Wind Power Source: http://www.bp.com/sectiongenericarticle
Gigawatt-hours Installed Wind Generation Capacity Source: http://www.bp.com/sectiongenericarticle
2005 Installed Wind Capacity Australia 708 MW 1% Asia 7,135 MW 12% Americas & Africa 10,979 MW 19% Europe 40,500 MW 68% Total Wind 59,322 MW Source: Global Wind Energy Council
Global Installed Wind Power Capacity ( Mw ) – Regional Distribution Africa & The Middle East Asia Europe Latin America & Caribbean North America Pacific Region Source: Wind Energy Fact Sheet, American Wind Energy Association, www.awaea.org
Global biofuels production stagnated, rising by just 0.7% or 10,000 barrels per day oil equivalent(b/doe), the weakest annual growth since 2000 Growth in the US (+55,000 b/doe, or 10.9%) slowed as the share of ethanol in gasoline approached the ‘blendwall’, and Brazilian output had the largest decline in our data set (-50,000 b/doe, or -15.3%) due to a poor sugar harvest. Biomass energy Source: http://www.bp.com/sectiongenericarticle
Million tonnes oil equivalent World biofuels production Source: http://www.bp.com/sectiongenericarticle
Million tonnes oil equivalent World biofuels production grew by 0.7% in 2011, the smallest increase since 2000. Increased output in North America was offset by declines in South & Central America and Europe. Biodiesel accounts for just 27.5% of global biofuels output, but accounted for all of the growth in global biofuels output. Global ethanol output declined by 1.4%. World biofuels production Source: http://www.bp.com/sectiongenericarticle
Geothermal Energy Geothermal capacity grew by just 0.8% (88 MW) in 2011, to reach 11 GW. Geothermal capacity has now been overtaken by solar power capacity, but geothermal power runs at a much higher load factor solar (its source is continuous rather than intermittent), so geothermal still produces significantly more electricity than solar.Only two major projects were completed in 2011, in Iceland (90 MW) and Costa Rica (42 MW), while Mexico shut down an old plant (78 MW). The US has the largest geothermal capacity, now just over 3.1 GW (28.3% of the world total), followed by the Philippines (2.0 GW), Indonesia (1.2 GW) and Mexico (0.9 GW). Source: http://www.bp.com/sectiongenericarticle800.do
Two geothermal systems were designed and are currently being installed by MENA Geothermal at the American University of Madaba (AUM), Jordan, to meet the full heating and cooling demands of the university. The geothermal heating and cooling systems at AUM, once completed, will be the largest in the Arab region Case of Geothermal Energy, Jordan Source: AFED, 2011
The College of Science’s geothermal system is designed to meet a • cooling load of 1020 kW (291 tons) • heating load of 880 kW (251 tons) • While the College of Business’s geothermal system is designed to meet a • cooling load of 660 kW (189 tons • and heating load of 470 kW (134 tons) Annual Energy and CO2 Savings. Compared to conventional heating and cooling systems used in Jordan, AUM’s geothermal heating and cooling system is expected to have annual savings of over 200,000 kWh of electricity in the summer months (cooling), and 90,000 liters of diesel fuel in the winter months (heating). In total, AUM will generate annual savings of over $85,000. Moreover, the geothermal system is expected to eliminate 365 tons of CO2 emissions every year. Geothermal System Features at American University of Madaba (AUM) Source: AFED, 2011
AUM’s operating cost comparision conventional VS. Geothermal (Heating Cooling) Source: AFED, 2011
AUM’s operating cost comparision conventional VS. Geothermal (Total) Source: AFED, 2011
Ocean Energy Wave technology is the most exciting areas of untapped energy potential. Given fluctuating fuel prices and the impact of global warming, Ocean Energy is now in a very strong position to commercialize the vast body of research and development it has invested in over the past 10 years. Source: http://www.oceanenergy.ie
Ocean Energy There are five different technologies under development, which aim to extract energy from the oceans. Tidal power:the potential energy associated with tides can be harnessed by building a barrage or other forms of construction across an estuary. Tidal (marine) currents:the kinetic energy associated with tidal (marine) currents can be harnessed using modular systems. Wave power:the kinetic and potential energy associated with ocean waves can be harnessed by a range of technologies under development. Temperature gradients:the temperature gradient between the sea surface and deep water can be harnessed using different ocean thermal energy conversion (OTEC) processes. Salinity gradients:at the mouth of rivers, where freshwater mixes with saltwater, energy associated with the salinity gradient can be harnessed using the pressure‐retarded reverse osmosis process and associated conversion technologies. None of these technologies is widely deployed as yet, but significant potential exists Source: http://www.oceanenergy.ie
Hydropower Energy Hydropower or water power is power derived from the energy of falling water, which may be harnessed for useful purposes. Since ancient times, hydropower has been used for irrigation and the operation of various mechanical devices, such as watermills, sawmills, textile mills, dock cranes, domestic lifts and paint making. Source: http://en.wikipedia.org/wiki/Hydropower
Hydropower Development Hydropower development ratio for world regions and top five countries with the highest potential Countries with largest developed proportion of their hydro potential (countries with hydropower production over 30 TWh/yr) Data Source: WEC Survey of Energy Resources 2007, IEA Renewables Information 2010 (2008 data)
Renewable Energy Renewable energy will stabilize electricity costs, as it is not dependent upon depleting resources. Photovoltaic systems will also increase access to electricity in rural areas without the need of complex policy decision-making, thus balancing the socioeconomic infrastructure of the region. For heating and cooling systems, and water desalinization. Thus, when considering these energy options on a larger scale, renewable energy is the most efficient choice in the long-run. The vast solar potential of the Middle East is waiting to be tapped.
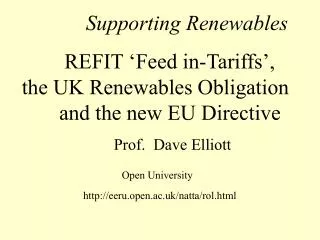
Renewable Energy Thekeyelements of thiscost-benefitcalculusappeartobe: • Decliningcosts (and thusprices) of renewableenergy and othersustainabilityproducts as technologyimproves and economies of scalearrive • Incentives thatwork in the favor of renewables: removal of subsidies forfossilfuels, taxcreditsforelectricvehicles, etc.
World energy consumption World primary energy consumption rose by 2.5% (2011). OECD countries fell by 0.8%. Oil continues to be world’s leading fuel at 33.1% of global energy consumption.
World consumption Million tones oil equivalent Source: http://www.bp.com
Regional consumption The Asia Pacific region is the world's largest energy consumer, accounting for 39.1% of global energy consumption and 68.6% of global coal consumption; the region also leads in oil and hydroelectric generation. Europe & Eurasia is the leading region for consumption of natural gas, nuclear power, and renewables. Coal is the dominant fuel in the Asia Pacific region; natural gas is dominant in Europe & Eurasia, and oil is dominant in all other regions.
The Asia Pacific region is the world's largest energy consumer, accounting for 39.1% of global energy consumption and 68.6% of global coal consumption; the region also leads in oil and hydroelectric generation. Europe & Eurasia is the leading region for consumption of natural gas, nuclear power, and renewables. Coal is the dominant fuel in the Asia Pacific region; natural gas is dominant in Europe & Eurasia, and oil is dominant in all other regions. Source: http://www.bp.com
Coal remains the most abundant fossil fuel by global R/P ratio, although global oil and natural gas reserves have increased significantly over time Source: http://www.bp.com
Energy Sector in Morocco ONE (national electricity Utility) IPPs in Morocco Dependency on imports: 97% Installed capacity: 6150 MW Transmission Source: www.one.ma
MASEN (Morocco Agency for solar energy) projects • Ouarzazate Site: • with a surface of about 33 square kilometers. i.e. 3,300 Hectares. This site is located close to the MansourEddahbi • dam whose storage capacity is 439 hm3. • Energy produced by the power plant may be channeled to the 225/60 KV post of Ouarzazate which is close to the power plant. • AinBeniMathar Site: • With a surface of about 3,000 hectares. • This site is close to the 400KV and 225KV grids. An aquifer allows to cover water needs of the power plant-which should remain ninimal with a dry-type cooling 2 1
MASEN (Morocco Agency for solar energy) projects The Foum El Oued Site: with a surface of 5,700 hectares. This line is a 225 & 60KV line, while waiting for the arrival scheduled in the mid-term of the 400 KV grid (Agadir-Layoune). Boujdour Site: With a surface of 500 hectaresConcerning the connection to the grid of the solar thermal plant to be developed on that site, one has to mention that the 225kV line, currently operating on 60kV linking the city of Laayoune to the city of Boujdour, goes close to the site. 3 4
MASEN (Morocco Agency for solar energy) projects SebkhatTah Site: with a surface of 360 sq. Kilometers. Characterized by an important depression of a height of 60 meters (180 feet) and an interesting wind potential, this site could be used as an energy compound, integrating in addition to a solar plant, a wind farm, and a pumped storage water plant. Concerning the connection to the grid of the solar thermal plant to be developed on that site, one should note that this zone is served by 225 kV lines, to be strengthened, in the medium term, by a 400 kV line between the cities of Agadir and Laayoune.Concerning the water resources, the open-circuit cooling would be made through a seawater intake, as is the case for the classical thermal plants, due to the proximity of the site with respect to the sea (11 kilometers/ 6.88 miles). 5
developing countries transition economies OECD INCREASE IN WORLD ENERGY PRODUCTION AND CONSUMPTION 7000 6000 5000 4000 Mton oil equivalent* 3000 2000 1000 production production consumption consumption 0 1971 – 2000 2000 – 2030 * 1 tonne of oil equivalent (toe) = 42 GJ (net calorific value) = 10034 Mcal Source: IEA 2002
MAJOR CHALLENGES IN ENERGY • Energy security: fuel supply resources for the future • Economic growth: accommodation of the developing nations’ needs • Environmental effects: global warming and emission control • Electricity system reliability: assurance of integrity of electric power infrastructure
Forecasted Renewable Costs 4030 20 10 0 100 80 60 40 20 0 PV Wind cents / kWh 1980 1990 2000 2010 2020 1980 1990 2000 2010 2020 70 60 50 40 30 20 100 1512 9 6 30 10 8 6 4 20 Solar thermal Biomass Geothermal cents / kWh 1980 1990 2000 2010 2020 1980 1990 2000 2010 2020 1980 1990 2000 2010 2020 All costs are levelized in constant year 2000 Source: NREL Energy Analysis Office (www.nrel.gov/analysis/docs/cost_curves_2002.ppt)
Hypothetical energy consumption breakdown in a large office building in a given Arab country
Number of operating nuclear reactors all over the world 440 nuclear reactors Source: Jordan Atomic Energy Commission
Number of nuclear reactors under construction around the world Source: Jordan Atomic Energy Commission
Key Challenges In Renewable Expansion • Integration into the grid • interconnection • grid capability • reliability issues • power quality • Competitiveness of technology costs • Environmental problems • Development of storage technology
Key Challenges In Renewable Expansion • Government policies at the • federal • state • Local • Regulatory accommodation • permitting processes • back up power • “green power” differential
Conclusions • Major difficulties in attaining target of 10% of electricity generated by renewables • Main contributors to this target will be :- • Offshore and Onshore windfarms/clusters • Biomass/wood, straw, etc • Photovoltaic • But policies like Climate Change Levy and the Renewables Obligation will help establish renewables.
Recommendations • Remove the current obstacles that prevent the transition to green energy, which include the lack of investment in research and development, capacity building and integrated policy-making. • To Reform the present legislative and institutional framework, to facilitate the transition to a green economy. • To establish an incentive system that encourage investment in energy efficient technologies and renewable energy. • To Adopt an energy efficiency plan and mange renewable energy issues aspillars of a new energy policy, built on a coordinated effort involving the government, the private sector, the financial sector and other stakeholders. • Constant adjustment for energy prices to reflect the actual economic cost, scarcity, the long-term marginal cost, and environmental damage. Further , it is required to reform the energy prices as an effective tool to rationalize energy consumption and to transform to low-carbon emission, which will concurrently lead to a vast increases in government revenues. Re-allocation of these revenues is also a must to enhance energy-efficient technologies and renewable energy expansion . • To Begin a political discussion on the formulation of a new institutional mechanism, to ensure the harmonization of energy policies and climate change in the Arab region.