Download
1 / 33
350 likes | 745 Views
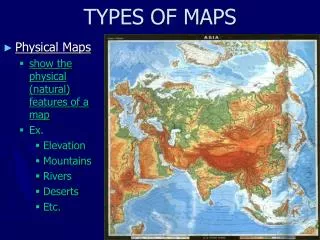
Types of Maps. Mercator Projections Conic Projections Gnomonic Projections Topographic Maps. Mercator Projections. Mercator Projection Is a map that has parallel lines of longitude and latitude Flaws Land Near Poles is exaggerated Shapes are correct, but land area is distorted.

E N D
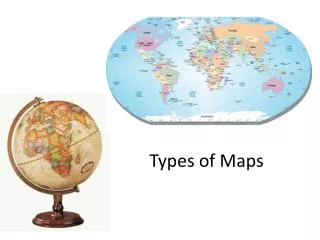
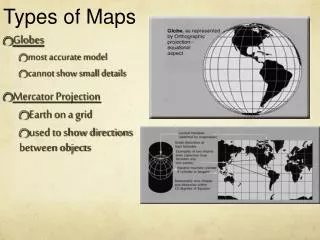
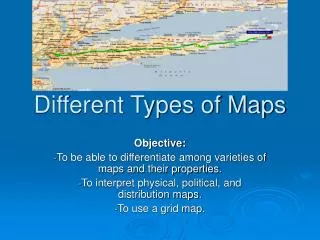
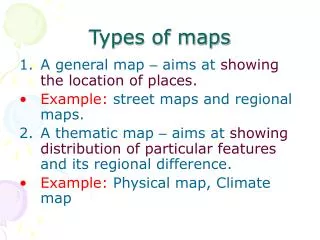
Types of Maps • Mercator Projections • Conic Projections • Gnomonic Projections • Topographic Maps
Mercator Projections Mercator Projection • Is a map that has parallel lines of longitude and latitude • Flaws • Land Near Poles is exaggerated • Shapes are correct, but land area is distorted
Conic Projections Conic Projection • Is made by projecting points and lines from globe onto a cone. • Very Little Distortion, High Degree of accuracy • Best for Mapping Small Areas • Used to make road and weather maps
Gnomonic Projections Gnomonic Projections • is made by projecting points and lines from a globe onto a piece of paper that touches the globe at a single point • Distort Directions and Distance • Used For Plotting great Circle Routes (Airplanes)
Topographic Maps Topographic Maps • Detailed maps that show the hills and valleys of an area • Use Lines, Symbols, and Colors to represent change in elevation
Map Features • Map Legends • Map Scales
Map Legends • Include symbols for both man made and natural features • Specific Colors for Habitats • Green for Woods • Blue for Water • See Appendix D on p. 914
Map Scales • Ratio of distance on a map to actual distances on the map • 3 Types • Verbal: “one inch equals one mile” • Graphic: consists of a line that represents a certain distance on Earth • Fractional: one unit on map represents one unit on Earth • Large Ratio: map covering large area (minor detail) • Small Ratio: map covering little are (major detail)
Isolines • An isoline is a line connecting points of equal value.
Examples of isolines: • Isotherms: • points of equal temperature • Isobar: • points of equal barometric (air) pressure • Contour: • points of equal altitude • Concentration of chemicals • Anything else you can get a value for. • (The weather channel loves isolines!)
Rules for Drawing Isolines: • 1. Isolines connect points of equal value. 5 5 10 10 10 10 15 15
2. Isolines are gentle, curving lines- no sharp corners. 5 5 10 10 10 10 15 15
3. Isolines are always closed curves even though the map might only show part of it.
4. Isolines NEVER cross- this would mean that one point has two different values. Ex: one spot has two temperatures? 60 ° 50 ° 40 ° 30 ° X 20° Z Y
5. Isolines usually are parallel. (They have a parallel trend.)
Visualizations of contour lines • http://geology.asu.edu/~sreynolds/topo_gallery/topo_gallery.htm
Gradient • Gradient shows how quickly the value changes from one point to another.
A steep (high) gradient changes quickly and the isolines are close together. • A gentle (low) gradient changes slowly and the lines are far apart. Steep area Gentle area
Making Contours worksheets • Worksheets can be printed from: • http://www.rcmurphy.net/Medina%202005/documents/Contours123.doc