Download
1 / 8
80 likes | 250 Views
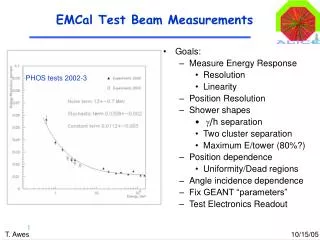
Beam Measurements at the Meson Test Beam Facility. Erik Ramberg AEM 19 May, 2008. G4Beamline simulation - New Differential Cerenkov counter First indications from CALICE measurements. Beam Rates and Content. Rates* without lead scatterer. Rates* with 1/4” lead scatterer.

E N D
Beam Measurements at the Meson Test Beam Facility Erik Ramberg AEM 19 May, 2008 • G4Beamline simulation • - New Differential Cerenkov counter • First indications from CALICE measurements
Beam Rates and Content Rates* without lead scatterer Rates* with 1/4” lead scatterer *Rates here are normalized to 1E11 at MW1SEM **Measured at exit of facility with PbG calorimeter
G4Beamline simulation created by Tim Rinn, St. Charles East H.S.
Results from G4Beamline Simulation of MTest Energy Lead (mm) #pions #electrons Ratio 1 GeV 0 710 9990 0.07 0.5 15 129 0.12 1 8 43 0.19 2 5 6 0.83 5 2 5 0.4 2 GeV 0 2440 9990 0.24 0.5 200 486 0.41 1 88 158 0.56 2 46 27 1.71 5 10 1 10 4 GeV 0 5030 9990 0.5 0.5 1198 1585 0.75 1 671 548 1.2 2 308 110 2.8 5 109 2 55
New Differential Cerenkov counter • Win Baker* copied design used successfully in MIPP • Jim Kilmer in charge of construction • Counter commissioned just before CALICE arrival • Timing of signals is just fast enough to be included in CALICE trigger • “Inner PMT” - accepts light near threshold • “Outer PMT” - accepts light from plateau region • “Inner x OutBar” - highly specific as to particle species • * Best Wishes! Outer PMT Inner PMT
Results from Differential Counter Inner only Outer only -10 GeV -12 GeV +20 GeV
Beam delivery for CALICE • CALICE experiment has challenged the capabilities of MTest,as well as provided the most sophisticated detector system to be installed there for beam measurements. • The AD has created beam tunes for: - Negative 1,2,3,4,6,8,10,12,15,20,30 GeV, as well as - Positive 32 GeV (high rate muon mode), 120 GeV - 1 second spill and 4 second spill MANY thanks go to Rick Coleman, Wally Kissel, External Beams Group and Operations CALICE Online plots 32 GeV muon mode 6 GeV
Some Concerns • As expected, the CALICE data taking rate at Fermilab is an order of magnitude slower than at CERN. • This discrepancy is dominated by the low duty cycle. It is important to keep the supercycle as close as possible to 60 seconds for a 5% allocation of beam. • Some of the effect is due to bunching of beam, as indicated by their data taking rate plot: • There is evidence for pion content at 2 GeV, as shown by the CALICE online plots, but so far there is no clear signal at 1 GeV. 2 GeV pions