Download
1 / 52
520 likes | 533 Views
Learn how age-expected child development, trajectories, and progress are key to program improvement and understanding developmental categories. Explore the impact of data collection and progress categories on child outcomes.

E N D
Module 5Understanding the Age-Expected Child Development, Developmental Trajectories and Progress Every day, we are honored to take action that inspires the world to discover, love and nurture the greatness in all children.
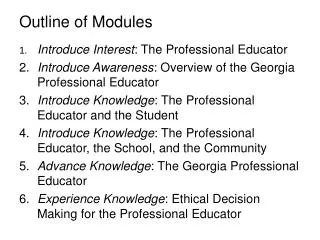
Overview of Modules • Module 1: Setting the Stage: Global Child Outcomes and the SFP • Module 2: Learning More About the SFP and COS Rating • Module 3: Essential Knowledge for Completing the SFP and COS Rating • Module 4: Guidance for Completing the SFP and COS Rating Within the Team Process • Module 5: Understanding Age-expected Child Development, Developmental Trajectories, and Progress • Module 6: Using COS Data to Inform Program Improvement at all Levels Kids' Potential, Our Purpose
Why collect data? Why All This Outcomes Data?What Happens with the Data?What Difference Does It Make? Kids' Potential, Our Purpose
After this module you will: • Understand how the entry and exit SFP ratings convert into progress categories used for federal reporting • Describe how these progress categories relate to developmental trajectories • Understand how the federal reporting categories are converted into the summary statements Kids' Potential, Our Purpose
Continuous program improvement Reflect Are we where we want to be? Check (Collect and analyze data) Plan (vision) Program characteristics Child and family outcomes Implement Kids' Potential, Our Purpose
Child Outcomes Summary Ratings 7: Completely age-expected 6: Between “completely” and “somewhat” 5: Somewhat age-expected 4: Between “somewhat” and “nearly” 3: Nearly age-expected 2: Between “nearly” and “not yet” 1: Not yet age-expected Kids' Potential, Our Purpose
Key Information for Progress Categories • The OSEP progress categories describe different types of progress children can make between program entry and exit • Two COS ratings (entry and exit), and the yes/no progress question, are needed to calculate what OSEP category describes a child’s progress Kids' Potential, Our Purpose
Progress Categories Kids' Potential, Our Purpose
Developmental Trajectories Kids' Potential, Our Purpose
Developmental Trajectories Kids' Potential, Our Purpose
Developmental Trajectories Kids' Potential, Our Purpose
Developmental Trajectories Kids' Potential, Our Purpose
How changes in SFP data correspond to reporting categories a-e Progress category “e” Percent of children who maintain functioning at a level comparable to same-aged peers • Rated 6 or 7 at entry; AND • Rated 6 or 7 at exit Kids' Potential, Our Purpose
Developmental Trajectories Kids' Potential, Our Purpose
Developmental Trajectories Kids' Potential, Our Purpose
Developmental Trajectories Kids' Potential, Our Purpose
How changes in SFP data correspond to reporting categories a-e Progress category “d” Percent of children who improve functioning to reach a level comparable to same-aged peers • Rated 5 or lower at entry; AND • Rated 6 or 7 at exit Kids' Potential, Our Purpose
Developmental Trajectories Kids' Potential, Our Purpose
How changes in SFP data correspond to reporting categories a-e Progress category “c” Percent of children who improved functioning at a level nearer to same-aged peers, but did not reach it • Rated higher at exit than entry; AND • Rated 5 or below at exit Kids' Potential, Our Purpose
Developmental Trajectories Kids' Potential, Our Purpose
Developmental Trajectories Kids' Potential, Our Purpose
How changes in SFP data correspond to reporting categories a-e Progress category “b” Percent of children who improved functioning, but not sufficient to move nearer to same-aged peers • Rated 5 or lower at entry; AND • Rated the same or lower at exit; AND • “Yes” on the progress question OR • Rated 6 or 7 at entry; AND • Rated 5 or lower at exit; AND • “Yes” on the progress question
Developmental Trajectories Kids' Potential, Our Purpose
Developmental Trajectories Kids' Potential, Our Purpose
Developmental Trajectories Kids' Potential, Our Purpose
Developmental Trajectories Kids' Potential, Our Purpose
How changes in SFP data correspond to reporting categories a-e Progress category “a” Percent of children who did not improve functioning • Rated lower at exit than entry; OR • Rated 1 at both entry and exit; AND • Scored “No” on the progress question (b) (questions 1b, 2b, or 3b on the rating form) Kids' Potential, Our Purpose
Developmental Trajectories Kids' Potential, Our Purpose
Developmental Trajectories Kids' Potential, Our Purpose
Progress Categories • Did not improve functioning • Improved functioning, but not sufficient to move nearer to functioning comparable to same-aged peers • Improved functioning to a level nearer to same-aged peers but did not reach it • Improved functioning to reach a level comparable to same-aged peers • Maintained functioning at a level comparable to same-aged peers Kids' Potential, Our Purpose
Following the Data 7 Points on Summary Ratings Scale + 1 Yes/No Progress = 5 Progress Categories x 3 Child Outcomes = 15 numbers to OSEP = 2 Summary Statements Kids' Potential, Our Purpose
Purpose of the Summary Statements • The Summary Statements allow states to consider all the children served in early intervention in two categories: • Those that experienced an increasein their development due to receiving services • Those that left the program at age expectations due to receiving services Kids' Potential, Our Purpose
The Summary Statements • Of those children who entered the program below age expectations in each Outcome, the percent who substantially increased their rate of growthby the time they exited the program. • The percent of children who were functioning within age expectationsin each Outcome by the time they exited the program. Kids' Potential, Our Purpose
Other Ways to Think about Summary Statement 1 • How many children changed growth trajectories during their time in the program? • Percent of the children who entered the program below age expectations made greater than expected gains, made substantial increases in their rates of growth, i.e. changed their growth trajectories c + d___ a + b + c + d Kids' Potential, Our Purpose
Example of Summary Statement 1 c + d___ a + b + c + d 539+809 = 51+966+539+809 1348 2365= 57.0% Kids' Potential, Our Purpose
Other Ways to Think about Summary Statement 2 • How many children were functioning like same aged peers when they left the program? • Percent of the children who were functioning at age expectations in this outcome area when they exited the program, including those who: • Started out behind and caught up and • entered and exited at age level d + e_ _ a + b + c + d + e Kids' Potential, Our Purpose
Example of Summary Statement 2 d + e_ _ a + b + c + d + e 1016+1043 = 48+869+659+1016+1043 2059 3635= 56.6% Kids' Potential, Our Purpose
The National DataPart C Early Intervention Kids' Potential, Our Purpose
Part C: Exited Within Age Expectations Trends Across 4 Years
The National Data- what is it telling us after four years? • For early intervention: • High percentages of children are showing increased rates of growth • High percentages of children are exiting functioning like same-aged peers • The data have been stable for 4 years • Part C and Part B Preschool are the only 2 federal EC programs with national data on outcomes Kids' Potential, Our Purpose
Child Outcomes Data • National Datahttp://ectacenter.org/eco/assets/pdfs/childoutcomeshighlights.pdf • Washington Datahttp://www.del.wa.gov/publications/esit/docs/LLA_report_card_FY12.pdf Kids' Potential, Our Purpose
Continuous Program Improvement Reflect Are we where we want to be? Check (Collect and analyze data) Plan (vision) Program characteristics Child and family outcomes Implement Kids' Potential, Our Purpose
Knowledge Check • Progress category and summary statement data are important for looking at data on a: • National level • State level • Program level • All of the above • True or False: The 1-7 ratings and the five progress categories are the same thing. • True • False Kids' Potential, Our Purpose
Knowledge Check • Progress category and summary statement data are important for looking at data on a: • All of the above • True or False: The 1-7 ratings and the five progress categories are the same thing. • False Kids' Potential, Our Purpose
Knowledge Check • True or False: In order to demonstrate progress, a child’s exit rating must be higher than their entry rating. • True • False • Child-specific data is converted into which for federal reporting: • Progress categories and summary statements • Developmental trajectories • Entry and exit ratings • None of the above Kids' Potential, Our Purpose
Knowledge Check • True or False: In order to demonstrate progress, a child’s exit rating must be higher than their entry rating. • False • Child-specific data is converted into which for federal reporting: • Progress categories and summary statements Kids' Potential, Our Purpose
Reflection • Now that I understand what happens to the data after I enter it in the DMS, what do I need to do to improve my ability to get high quality, accurate data on each child? • How does understanding the developmental trajectories change my approach to the SFP process? Kids' Potential, Our Purpose
Additional Resources • Table explaining the five progress categories:http://www.ectacenter.org/eco/assets/pdfs/Federal_Reporting_Categories.pdf Activity: Converting to Progress Categories:http://www.ectacenter.org/eco/pages/training_activities.asp#COSF_Federal_Progress Kids' Potential, Our Purpose
Additional Resources • Information about Summary Statements:http://www.ectacenter.org/eco/pages/fed_req.asp#SummaryStatements • Self-directed learning- developmental trajectories:https://unc-fpg-cdi.adobeconnect.com/_a992899727/ecotrajectories/ Kids' Potential, Our Purpose