Download
1 / 127
1.3k likes | 1.36k Views
Explore the strong link between fitness, physical activity, and reduced cardiovascular mortality, supported by numerous studies. Discover how exercise lowers the risk of coronary heart disease and overall mortality. Learn about the physiological adaptations to different types of exercise and their benefits for heart health. Find out how regular physical activity can significantly decrease the chances of developing cardiovascular diseases, as shown in various research findings.

E N D
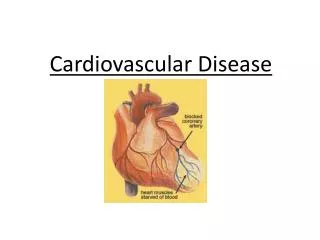
Physical Activity and Cardiovascular Disease ANDREAS PITTARAS MD
Survival of the Fittest “…in the last 15 years, many epidemiological studies have shown an unequivocal and robust relationship of fitness, physical activity, and exercise to reduce overall and CVD mortality.” Balady JG, New Engl J Med 2002;346 (11):852-53
Coronary Heart Disease and Physical Activity of WorkMorris JN, et al. Lancet1953:2:1053-1120 Approximately 50% lower risk of CHD in those with physically demanding (i.e. mail carriers) vs those with sedentary occupations (i.e. desk clerks).
Physical Activity and the Incidence of Coronary Heart DiseasePowell KE, et al. Annu Rev Public Health 1987; 8:253-87 121 studies reviewed; 43 were included. The relationship between sedentary lifestyle and increase risk of CHD is likely to be causal.
Relative Risk for CAD Ann Review Public Health 1987; 8:253-87 RR Physical Inactivity SBP>150 mm Hg TC>268 mg/dL Smoking >1 pack
Population Attributable Risk by Risk Factor Population Attributable Risk (%)
It is Estimated that 250,000 Deaths/Year in the USA are Attributable to Lack of Regular Physical ActivitySiegel PZ, at al., Weekly Reports 1991
Physical Activity Status in US Population 20% - 22% - Exercise Regularly 40% - 54% - Some Activity 24% - 40% - Sedentary 34% of pts are being counseled by physicians to begin or continue exercise.
AHA Position StatementCirculation 1991:86(1):340-44 Physical inactivity an as independent risk factor for the development of CHD equal in status to the traditional risk factors of HTN, DM, Dyslipidemia and smoking.
Exercise Type ? Most information is derived from aerobic exercise studies. Some evidence from occupational studies support that repeated busts of high energy output may offer protection against premature coronary mortality.
Dynamic/Isotonic Exercise Low Intensity Aerobic FFA as Fuel High Intensity Anaerobic CHO as Fuel -Walking -Jogging -Cycling Strength Training
Physiologic Adaptations to Exercise Training Chronic exercise of proper intensity, duration and frequency imposes a demand on the body. Consequently, the body makes appropriate and specific changes to accommodate the imposed demand.
Decrease Rest HR & BP Rest & Exercise RPP Exercise HR & BP (abs. WL) ESV Increase LV Chamber EDV SV CO VO2 max Cardiovascular Adaptations with Aerobic Exercise
No Change Rest HR & BP Rest & Exercise RPP Exercise HR & BP (abs. WL) ESV No Change LV Chamber ? EDV ? SV CO VO2 max Cardiovascular Adaptations with Anaerobic Exercise
Aerobic Volume Load Diastolic Stress New Fibers in Series Chamber size Eccentric LVH Anaerobic Pressure Load Systolic Stress New fibers in parallel Wall Thickness Concentric LVH LVH with Aerobic and Anaerobic Exercise
CHD Death in Norwegian Men 40-59 years of Age (N=2,014) Lie et al. Eur Heart J ’85; 147-57 P<0.001 CHD Daeth in 7 yr/100 FitnessQuartiles
CVD Death in Men (N=10,224) Blair et al. JAMA1989; 262:2395-2401 CVD Death /10,000 person-years METs
A Prospective Study of Walking as Compared with Vigorous Exercise in the Prevention of CHD in WomenManson JE, et al., NEJM 1999;341:650-8 • N = 72,488 Female Nurses • Age : 40 to 65 yrs old in 1986 • Free of CVD or Cancer • Follow-up: 8 yrs • Incidence of Coronary Events: 645 Fatal or Non-Fatal MI
Physical Activity & RR Adjusted for Confounding Factors (N=72,488) Mason JE, et al. NEJM:’99;341:650-8 P<0.001 Physical Activity Quintiles
Relative Risk for Coronary Events and Walking Pace (n=72,488) Mason JE, et al. NEJM:’99;341:650-8 Relative Risk Walking Pace (min/mile)
Relative Risk for Coronary Events and Walking Time Mason JE, et al. NEJM:’99;341:650-8 RR Minutes Walking/Wk
Relative Risk for Coronary Events and Walking Time in Women (n=72,488) Mason JE, et al. NEJM:’99;341:650-8 RR Minutes Walking/Wk
F I N D I N G S • Brisk Walking for 100-200 min/week at a Pace of <20 min/mile or <13 min/km. Reduces the Risk for Coronary Events in Women by 30 to 40 Percent. • Similar Caloric Expenditure Yields Similar Reductions in Risk for Coronary Events.
Are Exercise Health Benefits Long-Lasting? The Harvard Alumni study (n=16,936) has shown that Ex-Varsity athletes retained lower risk for CHD only if they maintained a physically active lifestyle throughout life. Paffenberger et al., Am J Epidemiol 1978 108(3):161-175
Relative Risk of CHD & Aerobic Activity in Men (N=51,529) RR Tanasescu M, et al. JAMA:’02;288:1994-2000 P<0.001
Survival for Fit & Unfit Men (n=9,777) Blair et al, JAMA 1995;273:1093-97 Survival Probability Unfit to Fit 44% Reduction in Risk Unfit to Unfit
How Much Exercise? Not an easy Question Exercise Intensity, Duration and Frequency must be considered, as well as the interaction. Caloric expenditure is one approach. Intensity still may play an independent role.
Physical Activity and All –Cause and CVD Mortality in Women >65 yrs Gregg EW, et al. JAMA’03;289:2379--86 Relative Risk CVD Kcal/wk
Weekly Energy Expanded and Relative Risk of CHD in Men (n=7,337) Lee, I-Min et al. Circulation 2003;107:1110-16 Relative Risk * Kcal/Week
Age-adjusted First MI Rates by Physical Activity (n=16,963) Paffenbarger et al., Am J Epidem. 1978;108(3):161-75 MI/10,000 person-yrs Total Non-Fatal Fatal
Exercise Intensity and Relative Risk of CHD in Men (n=7,337) Lee I-Min, et al. Circulation 2003;107:1110-16 Relative Risk Kcal/Week
Exercise Intensity and Relative Risk of CHD in Men (n=7,337) Lee I-Min, et al. Circulation 2003;107:1110-16 Relative Risk
Relative Risk of All-Cause Death and Exercise Capacity Myers J et al. NEJM 2002;346:793-801 RR of Death <6 METS 6-7.9 METS 8-9.9 METS 10-12.9 METS >13 METS Quintiles of Exercise Capacity
Survival Curves for Normal and CVD Patients According to Exercise Capacity Myers J et al. NEJM 2002;346:793-801
Conclusions Myers J et al. NEJM 2002;346:793-801 • Exercise Capacity is a more powerful predictor of mortality for CVD than other established risk factors. • A linear reduction in mortality. For each 1 MET increase in exercise capacity, a 12%, decrease in mortality was observed.
Exercise Capacity and Risk of Death in Women Gulati M, et al. Circulation 2003;108:1554-59 Hazard Ratio of Death 3.1 1.9
Conclusions Gulati M, et al. Circulation 2003;108:1554-59 • Exercise capacity is a strong and independent predictor of all-cause mortality in asymptomatic women, even after adjusting for traditional cardiac risk factors. • For each 1 MET increase in exercise capacity, a 17%, decrease in mortality was observed.
Exercise Threshold for Health Benefits METs < 4 – 5 7 10 ? Threshold Intensity Fast walk Running 6 km/hr 10 km/hr Kcal/wk 500 - 1000 3,000 120 min/wk 750 - 1050 1,500 240 min/wk 1500-2100 3,000
Exercise in Patients with Risk factors and/or Chronic Disease
Age-Adjusted CVD Death Rates &CHD Risk Factors (n=26,980) Blair, et al. JAMA 1996 51 Death Rate Death Rate 27.5 46 12.6 Cardiorespiratory Fitness
Relative Risk of All-Cause Death and Exercise Capacity Myers J et al. 2002;346:793-801 RR of Death >8 Mets 5-8 Mets <5 Mets
CV Events and Physical Activity in Diabetic Women (n=5125) Hu F, et al. Ann Intern Med :’01;134;96-105 Relative Risk * Hours/Wk
Relative Risk for Physical Activity & BMI, Adjusted For Risk Factors Mason JE, et al. NEJM:’99;341:650-8 RR >29 N=72,488 <29 Physical Activity Quintiles
F I N D I N G S • Brisk Walking for 100-200 min/week at a Pace of <20 min/mile or <13 min/km. Reduces the Risk for Coronary Events in Women by 30 to 40 Percent. • Similar Caloric Expenditure Yields Similar Reductions in Risk for Coronary Events.
Relative Risk of All-Cause Death and Exercise Capacity Myers J et al. 2002;346:793-801 RR of Death CVD Normal <6 METS 6-7.9 METS 8-9.9 METS 10-12.9 METS >13 METS Quintiles of Exercise Capacity
Conclusions Myers J et al. 2002;346:793-801 • Exercise Capacity is a more powerful predictor of mortality for CVD than other established risk factors. • A linear reduction in mortality. For each 1 MET increase in exercise capacity, a 12%, decrease in mortality was observed.