Download

1 / 10
100 likes | 119 Views
This report presents the results of the Business Assessment Test conducted at San Diego State University in 2010. The test covered various business topics and was administered to 1,939 test takers across 7 CSU campuses. The report includes comparative statistics and demographic comparisons.

E N D
Business Assessment Test Results San Diego State University 2010
General Method • 80 Multiple Choice Qs covering all business topics • Administered to 1,939 test takers on 7 CSU campuses during the 2009-2010 Academic Year • Questions come from a pool of questions developed across the CSU system • Analysis in 2007 allowed for the identification of 22 items of questionable validity. • Results in years since 2007 are reported both “Unadjusted” (including the 22 items thus allowing for comparisons to previous years’ results) and “Adjusted” (omitting the 22 items thus providing for a more valid test. • Efforts in Fall 2009 replaced some questions in Finance & Statistics • Efforts underway in 2010 to completely overhaul the exam producing a new and improved, more valid and comprehensive test.
SDSU Method • Exam administered in almost all Spring sections of MGT 405, during regular class time • 526 students took the exam (27.1% of total sample – largest of all campuses). • This included 402 in Spring 2010 & 124 in Fall 2009*. • All students received some form of extra credit incentive • Not true with all other CSU campuses • Following 2008 findings that calculator use did not make a difference in performance, test administration has reverted to “No Calculators Allowed” * One section took the test in Fall 2009 as part of a Closing the Loop pilot project.
Subject Area Results – SDSU vs. all CSU Percent of questions answered correctly within each subject area (all scores are adjusted to omit 22 questions)
SDSU Subject Area ResultsPercent of questions answered correctly within each subject area (all scores are adjusted to omit 22 questions)
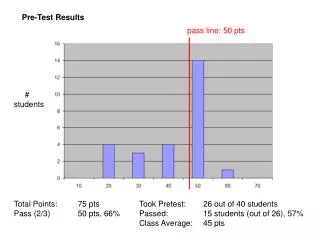
A closer look at statistics • Overall Performance: 42.30% • 301 Non-Takers 42.33% • 37.4% of the test takers • (FIN - 45.1%, IS - 36.8%, IB - 38.8%) • 301 Takers 42.28% • (ACC, MGT, MKT) 62.6% of the test takers • Among 301 Takers: • MKT (requires “C”) 46.71% • Others (ACC, 39.6% & MGT, 39.1%)