Download

1 / 60
600 likes | 725 Views
Reasonable Progress Demonstration Case Study for Saguaro Wilderness Area. Arizona Regional Haze Stakeholder Meeting January 22, 2007. Saguaro Wilderness Area. Saguaro West (SAWE). Saguaro NM (SAGU). Source: VIEWS website http://vista.cira.colostate.edu.

E N D
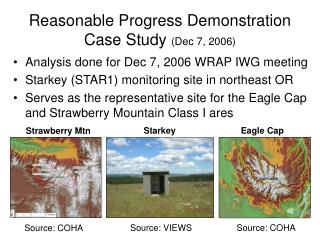
Reasonable Progress Demonstration Case Studyfor Saguaro Wilderness Area Arizona Regional Haze Stakeholder Meeting January 22, 2007
Saguaro Wilderness Area Saguaro West (SAWE) Saguaro NM (SAGU) Source: VIEWS website http://vista.cira.colostate.edu Source: WRAP Causes of Haze Website (http://coha.dri.edu)
SAGU Baseline Extinction Budget Source: WRAP Technical Support System >> Resources >> Monitoring >> Composition http://vista.cira.colostate.edu/tss/
SAWE Baseline Extinction Budget Source: WRAP Technical Support System >> Resources >> Monitoring >> Composition
20% Best Day Compositionat SAWE and SAGU Source: Chart made from two spreadsheets posted at: WRAP Technical Support System >> Resources >> Monitoring >> Composition
20% Worst Day Compositionat SAWE and SAGU Source: Chart made from two spreadsheets posted at: WRAP Technical Support System >> Resources >> Monitoring >> Composition
Reasonable Progress Under the Federal Regional Haze Rule • States set reasonable progress goals based on: • Consideration of 4 statutory factors • Costs • Time necessary for compliance • Energy and non-air quality environmental impacts • Remaining useful life of potentially affected sources • The uniform rate of progress (measured in deciviews) necessary to attain natural conditions by 2064 • States adopt long-term strategies to achieve these goals • States implement BART
Uniform Rate of Progress (worst days) Source: WRAP Technical Support System >> Resources >> Monitoring >> Trends
Uniform Rate of Progress (worst days) Source: WRAP Technical Support System >> Resources >> Monitoring >> Trends
Uniform Rate of Progress • Essentially a 20% reduction in manmade haze (dv) per planning period (10 years) • Heavily dependent on: • Assumptions regarding future natural conditions • Contribution of non-WRAP sources to baseline • Representativeness of 2000-04 baseline • 24 of the 77 Class I sites have no more than 3 years of data in baseline period • These issues more accute in the West • Haze rule promulgated in 1999
A Species-Based Approach to RP • Isolate some of the URP issues previously noted • Species differ significantly from one another in their: • Contribution to visibility impairment • Spatial and seasonal distributions • Source types • Contribution from natrual and international sources • Emissions data quality • Atmospheric science quality • Tools available for assessment and projection
Draft WRAP Protocol for Demonstrating Reasonable Progress • For each site and species … • Estimate progress expected from Base Case + BART in 2018 • Determine any other LTSs which may be reasonable for that pollutant and recalculate 2018 species concentration • Add up improvements from all species into dv • This becomes the RPG for the 20% worst days • Explain why this is less than URP • Large international and natural contributions, large uncertainties in dust inventory preclude action, etc.
Determine URP for a species Is Base+BART projection better than URP? Is WRAP Anthro reduction > 20%? N N Evaluate emission & air quality trends more closely Y Y Interstate coop key. Identify LTSs for these sources considering the 4 RPG and other factors identified in the RHR. Are there any important uncontrolled or undercontrolled sources? Are there any important uncontrolled sources? Y Y Adopt, commit to adopt, or commit to further evaluation. N* N Determine reductions at C1A. Repeat for other species. Add up all species reductions to get a RPG for worst days. Eplain why it’s less than default URP but still reasonable. Set goal for best days. * Note, if no LTS beyond BART is developed, then the 4 RPG factors are inherently taken into account via BART.
SAGU Species Trendsand URP Glidepaths (Worst Days) Peak day for OC on 10/30/03. Peak day for CM on May 31, 2003.
SAWE Species Trendsand URP Glidepaths (Worst Days) Peak day for OC on 10/30/03. Peak day for CM on May 31, 2003.
SAGU Upwind Residence TimeOn 20% Wost Visibility Days (2000-04) Source: WRAP Technical Support System >> Resources >> Area of Interest >> Weighted Emission Potential
NO3 • Is the Base+BART projection better than URP? • Yes: CMAQ base case projections for 2018 show a 20% reduction in extinction due to NO3. • Results do not yet include BART • Results not yet available on TSS • Precise projection method not yet finalized • WRAP anthro reduction is 28% • See PSAT results on next slide
NO3 • Are there any important uncontrolled upwind sources? • Use TSS to examine inventory upwind • PSAT results • PMF results • WEP results • Emission inventories
SAGU NO3 PSAT Results2002 and 2018 base cases Source: WRAP Technical Support System >> Resources >> Area of Interest >> SOx/NOx Tracer
SAWE NO3 PSAT Results2002 and 2018 base cases Source: WRAP Technical Support System >> Resources >> Area of Interest >> SOx/NOx Tracer
Source: Chart made after manipulation of data posted on WRAP Causes of Hase Website: http://coha.dri.edu/web/general/tools_PMFModeling.html
SAGU NO3 WEP Results (2000-04) Source: WRAP Technical Support System >> Resources >> Area of Interest >> Weighted Emission Potenital
SAWE NO3 WEP Results (2000-04) Source: WRAP Technical Support System >> Resources >> Area of Interest >> Weighted Emission Potenital
Major NOx Sources in the 2018 Arizona Point Source Pivot Table Source: WRAP website: Emissions Forum pivot tables: http://www.wrapair.org/forums/ssjf/pivot.html
Most Likely NOx Sources Significantly Contributing to NO3 at SAGU On the 20% Worst Visibility Days
SO4 • Is the Base+BART projection better than URP? • No: CMAQ base case projections for 2018 show only a 6% reduction in extinction due to SO4. • Sources outside the WRAP have a large influence • Results not yet available on TSS • Is WRAP anthro reduction > 20%? • No: PSAT apportionment shows only a 9% reduction from WRAP anthro SO2 sources • BART not fully included yet • Need to correct (reduce) 2018 Hayden emissions
SO4 • Are there any important uncontrolled or undercontrolled upwind sources? • Use TSS to examine inventory upwind • PSAT results • PMF results • WEP results • Emission inventories
SAGU SO4 PSAT Results2002 and 2018 base cases Source: WRAP Technical Support System >> Resources >> Area of Interest >> SOx/NOx Tracer
SAWE SO4 PSAT Results2002 and 2018 base cases Source: WRAP Technical Support System >> Resources >> Area of Interest >> SOx/NOx Tracer
Source: Chart made after manipulation of data posted on WRAP Causes of Hase Website: http://coha.dri.edu/web/general/tools_PMFModeling.html
SAGU SO4 WEP Results (2000-04) Source: WRAP Technical Support System >> Resources >> Area of Interest >> Weighted Emission Potenital
SAWE SO4 WEP Results (2000-04) Source: WRAP Technical Support System >> Resources >> Area of Interest >> Weighted Emission Potenital
Changes In Point and Area Source SO2 Emissions In AZ Area Source Changes
Most Likely SO2 Sources Significantly Contributing to SO4 at SAGU On the 20% Worst Visibility Days
SAGU OC CMAQ Results2002 and 2018 base cases AORGA Change = +6% (secondary anthropogenic OC) AORGB Change = +1% (secondary biogenic OC, inc. smoke) AORGPA Change = -1% (primary OC, inc. smoke) Source: WRAP Technical Support System
SAWE OC CMAQ Results2002 and 2018 base cases AORGA Change = 0% (secondary anthropogenic OC) AORGB Change = +2% (secondary biogenic OC, inc. smoke) AORGPA Change = -1% (primary OC, inc. smoke) Source: WRAP Technical Support System >> Resources >> Area of Interest >> Organic Aerosol Tracer
Source: Chart made after manipulation of data posted on WRAP Causes of Hase Website: http://coha.dri.edu/web/general/tools_PMFModeling.html
SAGU OC WEP Results (2000-04) Source: WRAP Technical Support System >> Resources >> Area of Interest >> Weighted Emission Potenital
SAWE OC WEP Results (2000-04) Source: WRAP Technical Support System >> Resources >> Area of Interest >> Weighted Emission Potenital
SAGU CM WEP Results (2000-04) Source: WRAP Technical Support System >> Resources >> Area of Interest >> Weighted Emission Potenital
SAWE CM WEP Results (2000-04) Source: WRAP Technical Support System >> Resources >> Area of Interest >> Weighted Emission Potenital