Download
1 / 1
10 likes | 119 Views
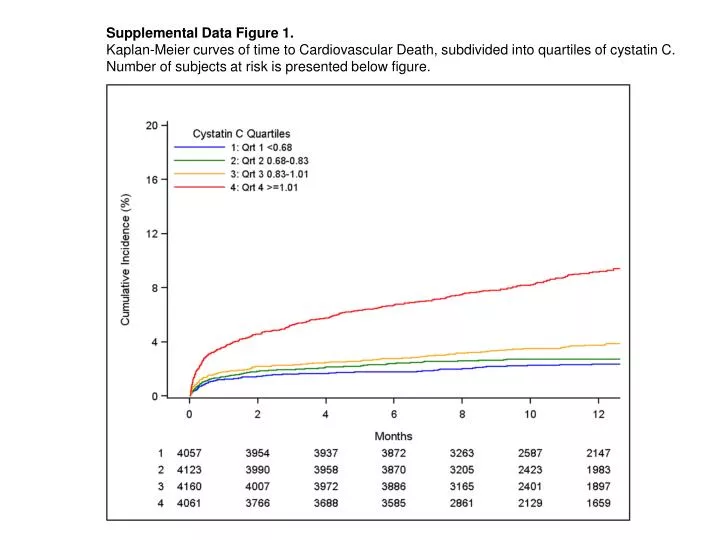
Supplemental Data Figure 1. Kaplan-Meier curves of time to Cardiovascular Death, subdivided into quartiles of cystatin C. Number of subjects at risk is presented below figure.

E N D
Supplemental Data Figure 1. Kaplan-Meier curves of time to Cardiovascular Death, subdivided into quartiles of cystatin C. Number of subjects at risk is presented below figure.