Download

1 / 23
230 likes | 375 Views
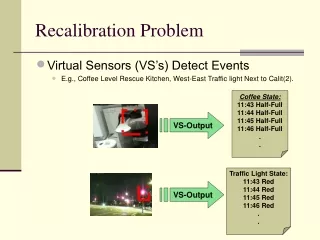
Scale recalibration effects in dementia patients and their proxies. Sander Arons Dept. of Epidemiology, Biostatistics and HTA Radboud University Nijmegen Medical Centre. Healthy. Death. Research. Methods Visual Analogue scale (VAS) Subjects Patient with dementia and their caregivers

E N D
Scale recalibration effects in dementia patients and their proxies Sander Arons Dept. of Epidemiology, Biostatistics and HTA Radboud University Nijmegen Medical Centre
Healthy Death Research • Methods • Visual Analogue scale (VAS) • Subjects • Patient with dementia and their caregivers • Research problem • Do patient and their caregivers use the VAS like ‘nomal’ patients? • Scale calibration • Research question • Is the scale recalibration in dementia patients and their proxies like ‘normal’ patients • Repeating results Uble, 2005
Best imaginable health state for someone your age Best imaginable health state for someone 25 years of age Best imaginable health state Worse imaginable health state Worse imaginable health state Worse imaginable health state Scale calibration X X X
Best imaginable health state for someone your age Best imaginable health state for someone 25 years of age Best imaginable health state X X X Worse imaginable health state Worse imaginable health state Worse imaginable health state B > A > C Uble 2005 A B C
Sample 1. Scoring “some” or “severe” problems on the domains of mobility or self care on the EQ-5D
Results • Hypothesis Uble 2005 • B > A > C • Patients • B = A > C • Patient by proxy • A > B > C • Proxy self • A > B > C
Best imaginable health state for someone your age Best imaginable health state for someone 25 years of age Best imaginable health state Worse imaginable health state Worse imaginable health state Worse imaginable health state Scale calibration X X X
Conclusions • Patients follow hypothesis Uble 2005 • Proxy “violate” hypothesis • proxy themselves hypothesis • Support the use of patient values • in this group…
Discussion • Why these 3 VAS’s? • Explanations • Are there more explanations than given in the discussion? • Scale proportions • Do the 3 VAS have different scales proportion • Are the units the same? • Are you really discussing “scale calibrations”
Why three VAS’s • Are the ‘other two’ VAS’s in use? • If not… • Is it because we think they are not ok? • Do they include everything we want to know?
Best imaginable health state for someone your age Best imaginable health state for someone 25 years of age Best imaginable health state Worse imaginable health state Worse imaginable health state Worse imaginable health state Explanation given X X X X “As the proxy assessment of patient HRQoL is lower when compared to people of the patient’s age, it seems likely that proxies use an anchor of a person of the patient’s age with a (similar) condition instead of an anchor of a healthy person of the patient’s age.”
Best imaginable health state for someone your age Best imaginable health state for someone 25 years of age Best imaginable health state Worse imaginable health state Worse imaginable health state Worse imaginable health state Coping X The best imaginable for such patient The best imaginable for such person X X X Decreasing possibility of coping (possibilities to shift anchors)
Best imaginable health state for someone your age Best imaginable health state for someone 25 years of age Best imaginable health state Worse imaginable health state Worse imaginable health state Worse imaginable health state Happy fool X He thinks that he is ok… But that is not the case… X X X Decreasing awarness of cognitive effects
Best imaginable health state for someone your age Best imaginable health state for someone 25 years of age Best imaginable health state Worse imaginable health state Worse imaginable health state Worse imaginable health state Judgment own efforts X The best imaginable what I can give this patient The best imaginable for such person X X X Decreasing coping on judgment of own efforts
Best imaginable health state for someone your age Best imaginable health state Worse imaginable health state Worse imaginable health state Scale calibration
Best imaginable health state for someone your age Best imaginable health state Worse imaginable health state Worse imaginable health state Scale calibration Represents less utility
No disease specific problems Healthy All disease specific complains Death Disease specific utilities are a subscale of a generic scale • Rescaling necessary
Raw disease specific trade-off ten to overestimated gains • Value of life years “traded off” in TTO differently • Healthy subject: 1 life year is 1.0 QALY • Sick subject: 1 life year is 0.8 QALY • Life years of healthy persons are more worth than those of sick • Disutility is proportional • 20% trade off at 1.00: disutility = 0.20 • 20% trade off at 0.80: disutility = 0.16 • 20% trade off at 0.60: disutility = 0.12
Best imaginable health state for someone your age Best imaginable health state Worse imaginable health state Worse imaginable health state Scale calibration Represents less utility
Solution: multiplicative model • Multiply disease specific value with average generic value of the patient group • For instance in IPSS • male age 55-64: overall QoL utility: 0.81 • Most severe BPH: 0.87 • Male age 55-64 with most severe BPH: 0.81 x 0.87 = .7047 • Maximum gain reduces from • Raw score 1.00 - 0.87 = 0.13 • Adjust score 0.81 - 0.70 = 0.11 • 15 % reduction
Linear or multiplicative? 100 – (25 x .90)
Conclusion • Nice paper • Surprising results given the hypotheses • But • Are all explanation in the paper? • Are indeed the scales the same? • Are the additive functions possible?