Download
1 / 32
320 likes | 441 Views
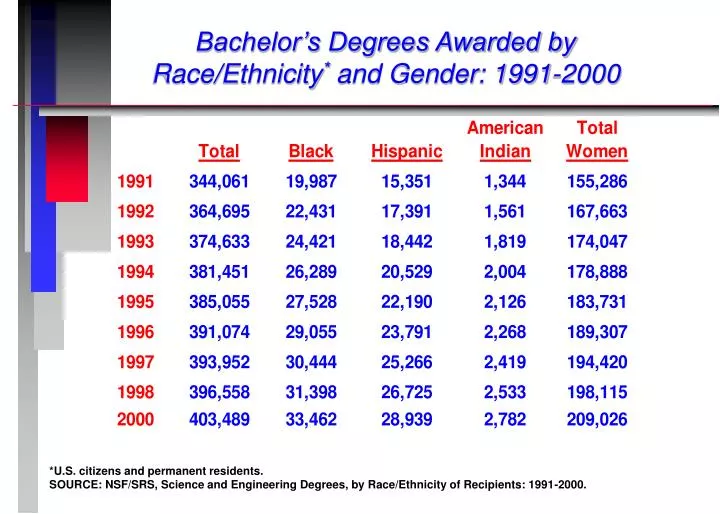
Bachelor’s Degrees Awarded by Race/Ethnicity * and Gender: 1991-2000. *U.S. citizens and permanent residents. SOURCE: NSF/SRS, Science and Engineering Degrees, by Race/Ethnicity of Recipients: 1991-2000.

E N D
Bachelor’s Degrees Awarded by Race/Ethnicity* and Gender: 1991-2000 *U.S. citizens and permanent residents. SOURCE: NSF/SRS, Science and Engineering Degrees, by Race/Ethnicity of Recipients: 1991-2000.
S&E Graduate Students In All Institutions (Full-time Enrollment), by Race/ethnicity* and Gender: 1990-2000 * U.S. citizens and permanent residents. SOURCE: NSF/SRS, Survey of Graduate Students and Postdoctorates in Science and Engineering: 2000.
S&E Doctorates Awarded by Race/ethnicity* and Gender, 1990-2001 *Race/ethnicity of U.S. citizens and permanent residents. SOURCE: NSF/SRS, Science and Engineering Doctorate Awards: 2001.
Representation of Black, Hispanic, American Indians, and Women in 2000 Note: U.S. citizens and permanent residents only. SOURCE: NSF/SRS, Completions Survey (NCES),NSF/ Survey of Graduate Students and Postdoctorates, and Survey of Earned Doctorates.
Women as a Percent of Full-Time S&E Faculty by Rank: 1991 NOTES: Faculty includes full, associate, and assistant professors plus instructors. Data for women in engineering and by instructor rank are based on a very small number of respondents. Life sciences include biological and agricultural sciences. Source: NSF/SRS, Survey of Doctorate Recipients.
Women as a Percent of Full-Time S&E Faculty by Rank: 2001 NOTES: Faculty includes full, associate, and assistant professors plus instructors. Data for women in engineering and by instructor rank are based on a very small number of respondents. Life sciences include biological and agricultural sciences. Source: NSF/SRS, Survey of Doctorate Recipients.
Percent of Full-time Doctoral S&E Full Professors Who Are Female, by Field: 1991 and 2001 Notes: Faculty includes full, associate, and assistant professors plus instructors. Excludes medical sciences. Life sciences include biological and agricultural sciences. SOURCE: NSF/SRS, Survey of Doctoral Recipients.
Percent of Full-Time Doctoral S&E Faculty Who are Black, by Field: 1991 and 2001 Notes: Faculty includes full, associate and assistant professors plus instructors. Excludes medical sciences. Percentages rounded because of small sample sizes. Life sciences include biological and agricultural sciences. Source: NSF/SRS, Survey of Doctorate Recipients.
Percent of Full-Time Doctoral S&E Faculty Who are of Hispanic Origin, by Field: 1991 and 2001 Notes: Faculty includes full, associate and assistant professors plus instructors. Excludes medical sciences. Percentages rounded because of small sample sizes. Life sciences include biological and agricultural sciences. Source: NSF/SRS, Survey of Doctorate Recipients.
Percent of Full-Time Doctoral S&E FACULTY Who are UNDERREPRESENTED MINORITIES, by Field: 1991 and 2001 NOTES: Faculty includes full, associate and assistant professors plus instructors. Includes Native Americans. Excludes medical sciences. Percentages rounded because of small sample sizes. Life sciences include biological and agricultural sciences. SOURCE: NSF/SRS, Survey of Doctorate Recipients.
Top 10 Institutions Enrolling Underrepresented Minority Graduate Students in S&E, 1996-2000 Hispanics • University of PR, Rio Piedras • University of PR, Mayaguez • Caribbean Center for Advanced Studies • Florida International University • California State University-Los Angeles • University of Texas at El Paso • Texas A&M University • University of California-Los Angeles • University of California-Berkeley • University of Southern California Blacks • Howard University • Southern University A&M Col • Texas Southern University • North Carolina Central University • Long Island University • Chicago State University • Clark Atlanta University • North Carolina Agricultural & Tech State Univ • University of Michigan, All Campuses • Georgia Institute of Technology SOURCE: NSF/SRS: Survey of Graduate Students and Postdoctorates in Science and Engineering, unpublished tabulations.
Top 10 Institutions Enrolling Underrepresented Minority Graduate Students in S&E, 1996-2000 American Indians • Oklahoma State University, All Campuses • University of Oklahoma, All Campuses • University of Kansas, All Campuses • University of Washington - Seattle • University of New Mexico, All Campuses • University of Colorado, All Campuses • Northern Arizona University • University of California-Los Angeles • University of Arizona • University of California-Berkeley SOURCE: NSF/SRS: Survey of Graduate Students and Postdoctorates in Science and Engineering, unpublished tabulations
Top 10 Institutions Enrolling Women Graduate Students in S&E, 1996-2000 Women 1. University of Minnesota 2. University of Colorado 3. George Washington University 4. University of California-Berkeley 5. University of Wisconsin-Madison 6. University of Washington-Seattle 7. University of Michigan 8. Texas A&M University 9. Rutgers the State University of New Jersey 10. New York University SOURCE: NSF/SRS: Survey of Graduate Students and Postdoctorates in Science and Engineering, 2000.
Underrepresented Minority Groups in S&E : 2001 NOTES: Underrepresented minority groups include: Black, Hispanic, and American Indian. For NSF proposal and award data, Pacific Islanders are also included. Source: NSF/SRS, Science and Engineering Degrees, by Race/Ethnicity of Recipients: 1991-2000, Science and Engineering Doctorate Awards: 2001; Survey of Doctorate Recipients.
Underrepresented Minority Groups in S&E : 2001 NOTES: Underrepresented minority groups include: Black, Hispanic, and American Indian. Source: NSF/SRS, Science and Engineering Degrees, by Race/Ethnicity of Recipients: 1991-2000, Science and Engineering Doctorate Awards: 2001; Survey of Doctorate Recipients.
Representation of Women in S&E: 2001 Source: NSF/SRS, Science and Engineering Degrees, by Race/Ethnicity of Recipients: 1991-2000, Science and Engineering Doctorate Awards: 2001; Survey of Doctorate Recipients, 2001.
Women Receiving DOCTORATE Degrees, 1980-2001 (Percentage of the Total) Note: U.S. citizens and permanent residents only. Source: NSF/SRS Survey of Earned Doctorates.
Representation of Women in S&E: 2001 Source: NSF/SRS, Science and Engineering Degrees, by Race/Ethnicity of Recipients: 1991-2000, Science and Engineering Doctorate Awards: 2001; Survey of Doctorate Recipients, 2001.
Representation of Women in S&E: 2001 Source: NSF/SRS, Science and Engineering Degrees, by Race/Ethnicity of Recipients: 1991-2000, Science and Engineering Doctorate Awards: 2001; Survey of Doctorate Recipients, 2001.
Statistical Profile of Persons Receiving Doctorate Degrees, 1980-2001 (Percentage of the Total) Note: Data refer to U.S. citizens and permanent residents only. Life sciences include biological and agricultural sciences. Source: NSF/SRS Survey of Earned Doctorates.
Representation of Minority Groups in Biological/Agricultural and Related Science in 2001 Source: NSF/SRS, Science and Engineering Degrees, by Race/Ethnicity of Recipients: 1989-97, Science and Engineering Doctorate Awards: 1998; Survey of Doctorate Recipients.
Representation of Women in Biological/Agricultural and Related Science in 2001 Source: NSF/SRS, Science and Engineering Degrees, by Race/Ethnicity of Recipients: 1991-2000, Science and Engineering Doctorate Awards: 2001; Survey of Doctorate Recipients, 2001.
Representation of Women in Biological/Agricultural and Related Science in 2001 Source: NSF/SRS, Science and Engineering Degrees, by Race/Ethnicity of Recipients: 1991-2000, Science and Engineering Doctorate Awards: 2001; Survey of Doctorate Recipients, 2001.
Representation of Women in Biological/Agricultural and Related Science in 2001 Source: NSF/SRS, Science and Engineering Degrees: 1966-2000, Science and Engineering Doctorate Awards: 2001; Survey of Doctorate Recipients, 2001.
Representation of Minority Groups in Biological/Agricultural and Related Science in 2001 * Excludes Clinical Psychology. Source: NSF/SRS, Science and Engineering Degrees, by Race/Ethnicity of Recipients: 1989-97, Science and Engineering Doctorate Awards: 1998; Survey of Doctorate Recipients.
Numbers of Women, Racial/Ethnic Groups, and Persons With Disabilities in Selected S&E Populations: 2001 * Estimates based on sample survey; subject to margin of error. Also details may not add to total due to rounding. ** Includes Pacific Islanders in underrepresented minorities. Includes foreign citizens on temporary visas in all categories. Notes: N/A = not available. Data for columns 2-7 include U.S. territories.
Numbers of Women, Racial/Ethnic Groups, and Persons With Disabilities in Selected S&E Populations: 2001 * Estimates based on sample survey; subject to margin of error. Also details may not add to total due to rounding. ** Includes Pacific Islanders in underrepresented minorities. Includes foreign citizens on temporary visas in all categories. Notes: N/A = not available. Data for columns 2-5 include U.S. territories.
Women PIs • Proposals from Women PIs constitute a growing share of proposals to BIO (to about 26% in FY 2002) • Their share of awards has also grown in a roughly comparable way (from 24% in FY93 to 27% in FY 2002) • Women’s share of proposals from New PIs is higher than for all PIs (28% vs. 24% in FY 2000) • Funding rates for women New PIs are higher than those for male New PIs (28% vs 20% in FY 2000)
Underrrepresented Minority PIs • Proposals from minority PIs constitute a growing share of proposals to BIO (to about 5% in FY 2002) • Minorities’ share of awards has also grown in a roughly comparable way (from 4% in FY93 to 6% in FY 2002) • Minorities’ share of proposals from New PIs is higher than for all PIs (6% vs. 3% in FY 2000) • Funding rates for minority New PIs are higher than those for non-minority New PIs (31% vs 21% in FY 2000)
Women S&Es, by Sector of Employment: 1999 Source: NSF/SRS. SESTAT database.
Women Doctoral S&Es, by Sector of Employment: 2001 Source: NSF/SRS. Survey of Doctorate Recipients.