Download
1 / 19
811 likes | 1.99k Views
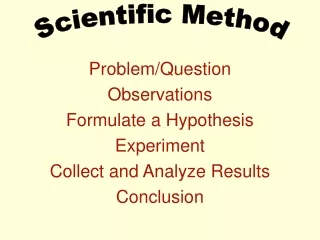
Scientific Method. Scientific Method – way in which scientists gather information and answer questions . The goal of science is to investigate and understand the natural world, explain events, and use those explanations to make useful predictions.

E N D
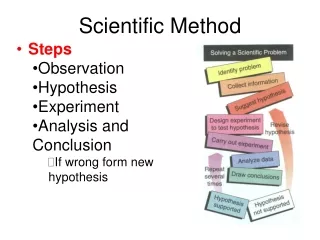
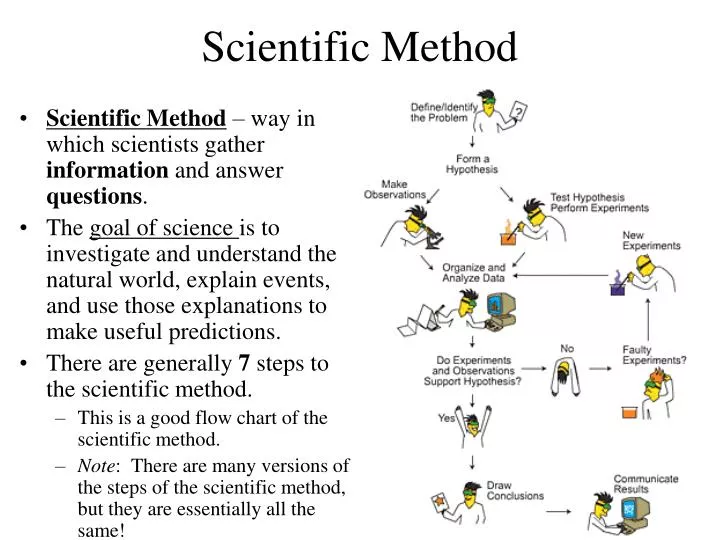
Scientific Method • Scientific Method – way in which scientists gather information and answer questions. • The goal of science is to investigate and understand the natural world, explain events, and use those explanations to make useful predictions. • There are generally 7 steps to the scientific method. • This is a good flow chart of the scientific method. • Note: There are many versions of the steps of the scientific method, but they are essentially all the same!
1. Stating the problem is something that you want to find out. • Example: Why did 10 people get sick at Saturday’s picnic? • 2. Gathering information on the problem: You must first Observe and gather facts! • Observation: All the people who got sick at the chicken, potato salad and/or ate ice cream within 72 hours. • Inference: What does this suggest?
Observation Versus Inference • There are two types of data scientists gather: quantitative and qualitative. • When scientists gather information, they begin with observations or the process of recording information in a careful or orderly way. This is called Quantitative data. • Scientists also use data to make inferences. This is a logical interpretation based upon prior knowledge or experiences. This is called Qualitative data. Let’s start out easy and then test your skills with a few observation versus inference games!
Game 1: What do you see? Just play the game, this is not in your notes!
Game 2: Fossil Footprints Mystery! What is happening at Position 1?
Your Turn! Examine the Following Statistics • Total Population: 2224 (1503 died) • Wealthy 329 (132 died) • Middle Class 285 (154 died) • Poor 710 (533 died) • Other/Unknown 900 (684 died) What is an Observation of this data?
What is an Inference from this data? • Total Population: 2224 (1503 died) • Wealthy 329 (132 died) • Middle Class 285 (154 died) • Poor 710 (533 died) • Other/Unknown 900 (684 died)
Now Add These Statistics • 94% Wealthy Women and Children Survived • 81% Middle Class Women & Children Survived • 47% Poor Women and Children Survived • 87% Other/Unknown Women & Children Survived What is another Observation of this data?
What is another Inference from this data? • 94% Wealthy Women and Children Survived • 81% Middle Class Women and Children Survived • 47% Poor Women and Children Survived • 87% Other/Unknown Women and Children Survived
Then Look at These Statistics • 69% Wealthy Men Died • 90% Middle Class Men Died • 86% Poor Men Died • 78% Other/Unknown Men Died What is your third and final Observation from this data? What is your third and final Inference from this data?
Conclusion:What was the most likely cause of death? Take one to two minutes to think and/or chat with your neighbor on the cause of death for these people and record your response on your notes!
The Answer! Survivor Rates on the Titanic: • Passengers: Women & Children Men TotalFirst Class 94% 31% 60%Second Class 81% 10% 44%Third Class 47% 14% 25%Crew 87% 22% 24% • Total Survivability: 31.6%How did your observations and inferences help you come to your conclusion? What other data would have been helpful before coming to your conclusion?
Forming a Hypothesis • Hypothesis – proposed solution or educated guess to the problem. • They must be proposed in such a way that they can be tested. (or testable.) • There can be multiple hypotheses or many solutions to a scientific problem! • Example: • 1. The chicken was bad and made people sick. • 2. The potato salad was bad and made people sick. • 3. The ice cream was bad and made people sick.
4. Performing experiments to test the Hypothesis • We must test the hypothesis to determine whether or not it is correct or explains what is going on in our problem. • Testing is done through experiments. • Example: Compare the items that made people sick to fresh food prepared the same way at the picnic. • Variable – the factor being tested, one at a time • Example: Samples of food items from the picnic. • Independent Variable – Factor you can manipulate • Dependent Variable – Factor that responds to the manipulation and can be measured.
Controls Positive control- helps determine if the procedure is being followed properly Negative Control- helps determine if experiment is being effected by something other than what is being tested. A negative result is expected. (example: water)
5. Recording and Analyzing Data • A) Data are Recorded observations and measurements. • Data is usually shown in a table or chart • B) Then data is made into a graph to show trends. • Makes information easier to see! • We’ll conduct a graphing experiment later!
Stating a conclusion7. Repeating the experiment • 6. Once you have looked at your data, you can draw conclusions. • Example: The chicken tested positive for salmonella, thus it was the agent that made people sick from the picnic. • The other people who were sickened that ate the other items but not the chicken were lactose-intolerant or allergic. • What if nothing was wrong with the food at all? How would you revise your hypothesis and conduct another experiment? • 7. In order to ensure your data is accurate AND to that your hypothesis accurately explains what is scientifically going on, experiments will be constantly repeated. • Remember, this is an important part of the Nature of Science!