Download
1 / 21
220 likes | 252 Views
Learn the types of graphs used in science - Pie for parts breakdown, Bar for comparisons, and Line for data relationships. See how to construct graphs from experimental data to draw valid conclusions.

E N D
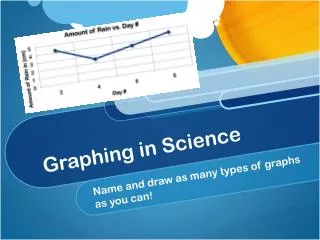
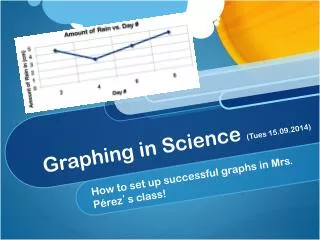
There are three main types of graphs: Pie Bar Definition: A model that helps us to picture the relationship between two variables. Line
Uses for the 3 main types…. • A circle graph is the best type of graph to show a fixed quantity broken down into parts • A bar graph is used to show comparisons among many categories • A line graph is used to show a relationship between large amounts of information
When a scientist conducts an experiment, he/she carefully observes what is happening. 30 s 18 0 20 0 60 s 22 0 90 s He/She records information called data. Time (s) Temp. (C) 0 s 15 0 The data is often a set of numbers.
It is important for scientists to be able to take data... #'s Such as numbers And make it into a visual “picture” of what the data says... In order to make valid conclusions from experiments...
Line graphs take data and give us a picture of what that data looks like: Temperature Time This graph helps us to understand the relationship between time and temperature.
changes changes Variables A variable is what “changes” in an experiment. Experiment: You are measuring the temperature in degrees Co of a water sample as it is heated over a period of 30 minutes.
To make graphs You need to know how to recognize the independent variables dependent
Experiment: You are measuring the temperature in degrees Co of a water sample as it is heated over a period of 30 minutes. 0 min 0 0 1 min 0 0 0 0 2 min 1 0 3 min 4 min 5 0 YouDECIDE the interval (each minute) to collect data (temperature). Time (min) Temp. (C) Interval you collect data or independent variable The data collectedor dependent variable at it is
In this table there are two variables: Time Temperature
Which is the independent variable? When constructing a graph, the x axis is most closely related to the independent variable. Time is the independent variable in this data table because this is the interval you chose to collect data. The scientist “controls” this variable. temperature
Which is the dependent variable? temperature ...is dependent on the time so the temperature is the dependent variable. This is the data that a scientist collects. time When constructing a graph, the y axis is most closely related to the dependent variable.
Steps for Constructing a graph 1. Determine the independent and dependent variables in your data table. 2. Label each axis: x-axis is independent and y-axis is dependent. 3. Find the variable range: “middle value” is halfway on the graph scale. 4. Number and label the each axis. 5. Plot the data points. 6. Connect the data points. 7. Title the graph.
1. Determine the independent and dependent variables in your table. This is information (data) you collected at that interval. You chose at what “interval” to collect the data. time temperature This is the INDEPENDENT Variable. This is the DEPENDENT variable.
2. Label each axis: x-axis independent and y-axis dependent. Temperature Dependent Variable y x Time Independent Variable
3. Find the range:“middle value” is halfway on the graph scale. Low 100 90 80 70 Middle 60 50 Temp. in C 40 30 7 or 8 needs to be about here... 20 10 1 2 3 4 5 6 7 8 9 10 11 12 13 14 15 0 Time in Minutes 4. Number and label the each axis. High
5. Plot the data points. Temperature of “Liquid A” as It Is Heated 0, 0 1, 0 100 2, 0 90 3, 3 80 4, 14 70 5, 25 6, 36 60 7, 47 Temp. in C 50 8, 58 40 9, 69 30 10, 80 20 11, 91 12, 98 10 13, 98 0 1 2 3 4 5 6 7 8 9 10 11 12 13 14 15 14, 98 Time in Minutes 15, 100 6. Connect the data points. 7. Title the graph.
Calculating Slope Rise Run What is the slope of this line? 2 /4 = .5