Download
1 / 6
70 likes | 273 Views
Graphing. Why are graphs important in Science?. A visual representation or “picture” of your data Organizes data Three common types of graphs used by scientists:. Circle. Line. Bar. Line Graphs.

E N D
Why are graphs important in Science? • A visual representation or “picture” of your data • Organizes data • Three common types of graphs used by scientists: Circle Line Bar
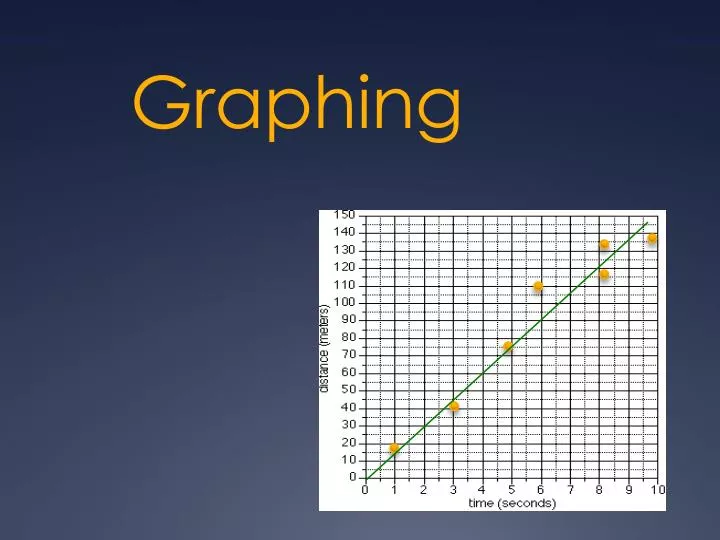
Line Graphs • Line Graphs are used in science to show how the dependent (responding) variable changes in response to the independent (manipulated) variable. • They help identify trends (patterns) in data. No Trend = No Relationship Linear Trend Nonlinear Trend
Graph Parts Y-Axis = Dependent Variable 30 25 20 15 10 5 Best Fit Line- shows the general pattern of the data. It does not have to connect all points. Vertical Axis Data Points Horizontal Axis 0 10 20 30 40 50 60 Origin X-Axis = Independent Variable
Slope (60,30) 30 25 20 15 10 5 Coordinate Points = (X, Y) (50,25) (40,21) Slope = rise = run Y2-Y1 X2-X1 (20,11) (31,14) (10,5) (0,0) 0 10 20 30 40 50 60
Calculating Slope Slope = rise = Y2-Y1 = 30-0 = 30 run X2-X1 60-0 60 Slope of this line = 1 = 0.5 2 You can choose any 2 coordinate points on the best fit line to calculate slope- you WILL get the SAME slope every time! Y2-Y1 = 20-5 = 20 = 1 X2-X1 50-10 40 2 SAME SLOPE with the two new points!