Download
1 / 11
110 likes | 243 Views
Graphing. Creating a picture of your data. A graph is…. a picture of your data. Make sure it is a clear picture that helps your reader understand your data. TAIL… elements of a good graph. T = title ( must name the graph )

E N D
Graphing Creating a picture of your data
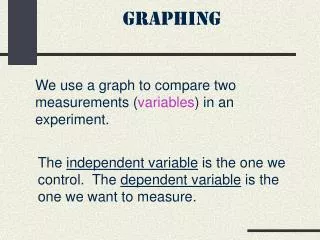
A graph is… a picture of your data. Make sure it is a clear picture that helps your reader understand your data.
TAIL…elements of a good graph T = title (must name the graph) A = axes (x and y axes for line graphs, bar graphs, histograms, scatterplots, etc) I = intervals (fit your data to your graph using intervals that make sense. AVOID BREAKS!) L = labels (titles for the axes otherwise we don’t know what we are looking at!)