Download
1 / 9
90 likes | 333 Views
Drug delivery in mouse brain. LPPD lab seminar, Wednesday, November 14, 2007. Madhu Smitha Harihara Iyer Master’s Student Department of Bioengineering, UIC Advisor: Prof. Andreas Linninger Laboratory for Product and Process Design ,

E N D
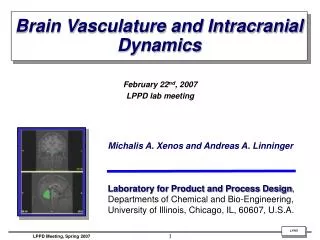
Drug delivery in mouse brain LPPD lab seminar, Wednesday, November 14, 2007 Madhu Smitha Harihara Iyer Master’s Student Department of Bioengineering, UIC Advisor: Prof. Andreas Linninger Laboratory for Product and Process Design, Departments of Chemical and Bio-Engineering, University of Illinois, Chicago, IL, 60607, U.S.A.
Motivation • Neurodegenerative diseases like Alzheimer’s, Parkinson’s, and Huntington’s disease affect millions of people around the world every year. • 5 million Americans suffer from Alzheimer's disease; 1 million from Parkinson's; 400,000 from Multiple Sclerosis; 30,000 from Amyotrophic Lateral Sclerosis and 30,000 from Huntington's disease. • Statistics predict that 30 years from now, more than 12 million people in the United States of America alone; would be affected by these neurodegenerative diseases. • Finding effective treatment for these diseases is a goal of increasing urgency.
Goal • Prediction of drug distribution in the animal brains (mouse) • T1/T2 images by performing DT-MRI • 3D- reconstruction of the brain sub-structures • Generate computational grids • Filling DTI data • Calibration • Simulation • Validate with experimental data
3D Reconstruction using MIMICS Cortex Reconstructed 3D Structure
Converting Virtual volume to real in Gambit Input STL file Delete virtual volume without removing the lower geometry Convert virtual vertices to real Convert virtual edges to real Stitch the faces to form a real volume Convert virtual faces to real Mesh the real edges
Ventricular system 3D Structure Reconstructed using MIMICS Computational grids using GAMBIT
Future steps • Prediction of drug distribution in rat brain • Perform DT-MRI for rat brain and create T1/T2 images • 3D reconstruction of the substructures • Generate computational grids • Filling the DTI data • Calibration • Simulation • Analysis of Dye Distribution in three-dimensional Agarose Gel Phantoms using MRI • Infusion experiments with Gd or with Gd-tagged BPB dye in Agarose gel phantoms • Testing new MRI compatible catheters • Perform MRI analysis, generate concentration profiles and calculate volume distribution • Validation of the MRI results with simulations