Download
1 / 9
90 likes | 221 Views
Graphing Sinusoids. Sinusoids. Sinusoid graphs are used to represent objects that have simple harmonic motion. Definitions. Simple Harmonic Motion - If an object has vibrations, then it has simple harmonic motion. Example – swing going back and forth

E N D
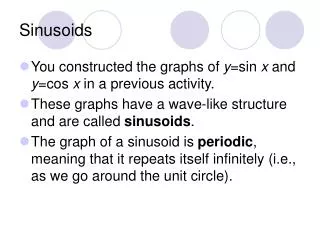
Sinusoids • Sinusoid graphs are used to represent objects that have simple harmonic motion.
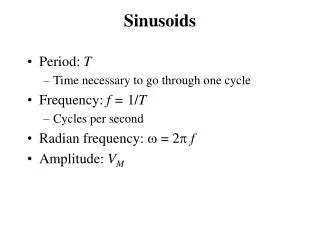
Definitions • Simple Harmonic Motion - If an object has vibrations, then it has simple harmonic motion. • Example – swing going back and forth • Frequency – number of cycles in a period of time(sound pitch) • Hertz – unit of measure for vibrations/second • Amplitude – distance from the center line points to the maximum/minimum points (sound volume)
Definitions • Period – length of one cycle • Key Point Intervals – where you are going to plot the points of your sinusoid graphs • Sine: starts at center, then goes to the max amplitude, back to center, and down to min amplitude • Ex – (one cycle) • Cosine: starts at max amplitude, down to center, down to min amplitude, back to center, and back to max amplitude • Ex – (one cycle)
Equation for Simple Harmonic Motion A – amplitude - horizontal stretch/shrink T - time
Other Equations Needed • Period - • Key Point Intervals - • Frequency -
Graphing • To demonstrate how to graph a sinusoid, we are going to use the example equation:
Graphing: Step One • Find Period: ==4 • Find Key Point Intervals: • Find Amp: 8
Graphing: Step 2 • See the video on the website