Download
1 / 9
90 likes | 99 Views
Explore how the ethnic demographics and special needs enrollment at Marshall High shifted from 2002-03 to 2003-04. Delve into attendance trends and personalized education initiatives like advisories and tutoring.

E N D
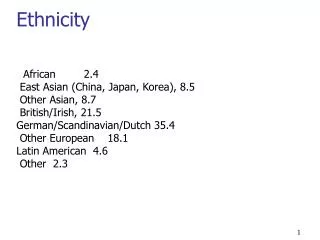
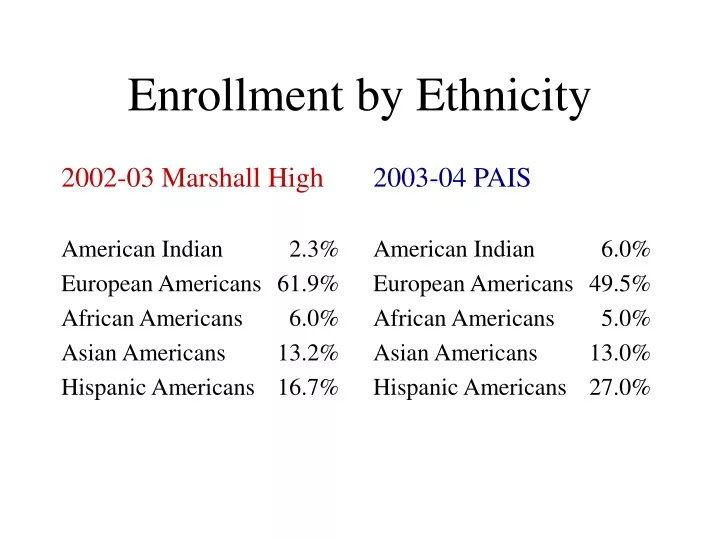
2002-03 Marshall High American Indian 2.3% European Americans 61.9% African Americans 6.0% Asian Americans 13.2% Hispanic Americans 16.7% 2003-04 PAIS American Indian 6.0% European Americans 49.5% African Americans 5.0% Asian Americans 13.0% Hispanic Americans 27.0% Enrollment by Ethnicity
2002-03 Marshall High ESL 15.6% Special Education 14.6% Free/Reduced Lunch 54.1% TAG 3.3% 2003-04 PAIS ESL 23.4% Special Education 22.0% Free/Reduced Lunch 71.0% TAG 2.0% Enrollment by Special Needs
Attendance Trends Marshall Attendance 2002-03 91.1% Marshall Attendance 2003-04 82.1% PAIS Attendance February 2005 84.48%
Personalizing Education 1) Advisories 2) Calls Home 3) Increased Student Voice 4) Weekly Staff Meetings – All Staff 5) Parent Conferences 6) Supplemental Educational Services Tutoring