Download
1 / 28
290 likes | 503 Views
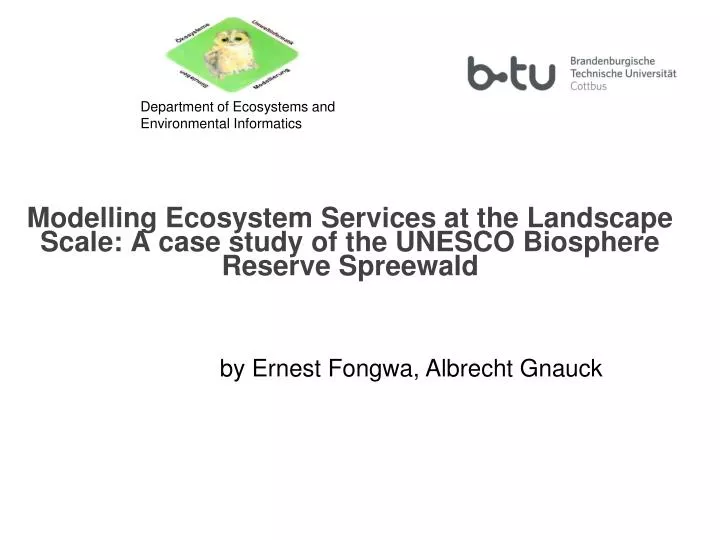
Modelling Ecosystem Services at the Landscape Scale: A case study of the UNESCO Biosphere Reserve Spreewald. Department of Ecosystems and Environmental Informatics. by Ernest Fongwa, Albrecht Gnauck. 1. Contents. Introduction Methodology Application to UNESCO Biosphere Reserve Spreewald

E N D
Modelling Ecosystem Services at the Landscape Scale: A case study of the UNESCO Biosphere Reserve Spreewald Department of Ecosystems and Environmental Informatics by Ernest Fongwa, Albrecht Gnauck 1
Contents • Introduction • Methodology • Application to UNESCO Biosphere Reserve Spreewald • Discussion • Conclusions
Introduction • Ecosystem Services are the benefits that human derive from the natural ecosystem • They are spread over the landscape depending on the water catchment area and also from rural to urban areas or from one administrative unit to another • However, they can be find everywhere, but their capacity differ with landscape characteristics • They are classified under 5 types
Methodology • Typical service units for studying ecosystem services can be defined and constructed by Petri nets • A Petri net is a graphical and mathematical technique for modelling flow system and have been used in many fields such like fresh water ecology, molecular biology, business, transport and logistic etc. • It can be used for continuous, discrete, stochastic and hybrid modelling and simulation • That is continuous, time, stochastic, hybrid, place /transition and high level nets like coloured Petri net, which may be discrete, continuous or stochastic and even hybrid Petri nets • Data are collected in the UNESCO biophere reserve Spreewald based on observation and scaling by give rank values that are aggregated for simulation of the model
Petri Net Modelling Framework An ecosystem example of algae growth
N= (S,T,W) Petri net is defined as N and described as a triple (S, T, W) S= {s1, s2, s3, s4} T= {t1, t2, t3, t4, t5, t6, t7, t8} W- Flow rate Each Set in S contain markings with tokens Description of relationships
Definition of Coloursets • Markings and their set of tokens are differentiated by colours • Markings: Comp = {Comp1, Comp2, Comp3} • Tokens: ES= {ES1, ES2, …, ES5} • Coloursets: • Colours =
Data Sampling Strategy • Data Collection is based on cross-sectional field observation in the UNESCO biosphere reserve Spreewald • The data source comprises of landscape components associated with ES, activities that lead to their balance, improvement and deficit and indicators • They are quantified by qualitative value judgement based on ranking them to a scale of 0 to 5 • 0 (no relevant capacity), 1 (very low relevant capacity), 2 (low relevant capacity), 3 (medium relevant capacity), 4 (high relevant capacity) and 5 (very high relevant capacity)
Data Sampling Strategy • Preparatory Set Up for Data Collection • Data Collection • Data Aggregation Procedures • Quality Assurance of Data • - Estimators: Unbias and Consistency
If : ΣSt - old stock of ES in a particular region Then: ΣSt ± ΔΣSt- current stock (phase transition) For environmental balancing for preserve ES: ΔΣSt 0 or ΔΣSt = 0 For environmental improvement for preserving: ΔΣSt > 0 For environmental deficit for preserving ES: ΔΣSt < 0 Parameter for EstimatingEcosystem Services
Petri Net Simulation Framework • Data conversion • Encoding data in the Petri net • Specification of initial marking based on data set • Simulation • Show case and scenarios
Conclusions • MES can encourage the preservation of ES with market for certification scheme already growing in Spreewald region, but there are no markets for permit and conservation credit/banking. • These markets for ecosystem services need to be encourage by increasing measures for preservation of ecosystem services. • However, there are current discussion on the legal system on pools for balancing landscape problems, this may favour the growth of MES and community-based financial participation. • Therefore data management systems are essential for analysis and structuring strategic measures for preserving ES, which has been realised in the modelling and data sampling framework.