Download
1 / 56
560 likes | 584 Views
Explore the history and advancements in electric industry evolution, from early discoveries to modern innovations, in this slide deck by James D. McCalley, Professor of Electrical Engineering at Iowa State University.

E N D
“Energy Systems” A Critical National Infrastructure Slide Deck #1 James D. McCalley Professor of Electrical and Computer Engineering Iowa State University Ames, IA WEBPAGE: http://home.engineering.iastate.edu/~jdm/ee303/ee303schedule.htm HELPFUL BOOK: https://onlinelibrary-wiley-com.proxy.lib.iastate.edu/doi/book/10.1002/9781119994404
National Academy of Engineering rankings for greatest engineering achievement of the 20th Century. Criteria: transformation of human life. • Automobile • Telephone • Radio/television • Interstate highways • Electrification • Internet • Spaceflight • Nuclear technologies • Electronics • Computer • Airplane • Water supply 2 9 6 11 1 13 12 19 5 8 3 4 See www.greatachievements.org
Content of these slides • Evolution of electricity industry • Integrated electric energy systems • Power systems: how they work • Power systems: what can go wrong? • The 2003 NE Blackout • The future of energy
1827: George Ohm discovered the relation between voltage, current, and resistance. 1820: Hans Oerstead discovered magnetic effects of a current on a compass needle. 1752: Ben Franklin proves lightning is electricity 1820:Marie Ampere discovered a coil of wire acts like a magnet when carrying current. 1736: James Watt invents steam engine. 1600: William Gilbert invents the compass. 1732: Stephen Gray discovers conduction.. 1745 Musschenbroek invents Leyden jar (capacitor) 1785: Charles Coulomb discovers relation between force and charge. 1827: Joseph Henry discovered inductance. 1873: James Maxwell wrote equations describing electro-magnetic fields, and predicted the existence of electromagnetic waves. 1845: Gustav Kirchoff developed laws enabling the efficient calculation of currents in complex circuits. 1879: Edison invented the incandescent lamp and in 1882 supplied Pearl St (NY) with light from DC generator. 1855: Wilhem Weber defined units for current and resistance. 1888: Nikolai Tesla patented the AC polyphase motor. 1888: H. Hertz experimentally verified Maxwell’s equations 1895: George Westinghouse harnessed Niagara Falls and commercialized AC generation, transformation, and transmission. 1831: Michael Faraday discovered Faraday’s law and invented the generator 1835: Johann Gauss related magnetic flux & electric charge. 1886: William Stanley invented the transformer. Evolution of Electric Industry 1792: Alessandro Volta invented the battery.
“Westinghoused” 1827: George Ohm discovered the relation between voltage, current, and resistance. 1820: Hans Oerstead discovered magnetic effects of a current on a compass needle. 1752: Ben Franklin proves lightning is electricity 1820:Marie Ampere discovered a coil of wire acts like a magnet when carrying current. 1736: James Watt invents steam engine. 1600: William Gilbert invents the compass. 1732: Stephen Gray discovers conduction.. 1745 Musschenbroek invents Leyden jar (capacitor) 1785: Charles Coulomb discovers relation between force and charge. 1827: Joseph Henry discovered inductance. 1873: James Maxwell wrote equations describing electro-magnetic fields, and predicted the existence of electromagnetic waves. 1845: Gustav Kirchoff developed laws enabling the efficient calculation of currents in complex circuits. 1879: Edison invented the incandescent lamp and in 1882 supplied Pearl St (NY) with light from DC generator. 1855: Wilhem Weber defined units for current and resistance. 1888: Nikolai Tesla patented the AC polyphase motor. 1888: H. Hertz experimentally verified Maxwell’s equations 1895: George Westinghouse harnessed Niagara Falls and commercialized AC generation, transformation, and transmission. 1831: Michael Faraday discovered Faraday’s law and invented the generator 1835: Johann Gauss related magnetic flux & electric charge. 1886: William Stanley invented the transformer. Evolution of Electric Industry 1792: Alessandro Volta invented the battery.
Evolution of Electric Industry • 1903 Samuel Insull understanding economies of scale (generators when scaled up produce power at a lower $/kWhr – big is better!) installs 5 MW generator in Chicago and manages load to increase his load factor (avg load/max load) to increase profits • 1907 Insull realizes that profitability from managing economies of scale and load factor grows with corporate size, and so forms Commonwealth Edison, Chicago, by buying all of his competitors. • 1907 States begin recognizing electric companies as natural monopolies similar to the railroads, with large economies of scale requiring huge capital investment so that it was not socially efficient to have multiple competitors Transmission switcheson wooden towers, 1906 Steam turbo-generators,Long Island railways, c.1907 Fiske Street Station steam turbineChicago, c.1907
Evolution of Electric Industry • 1914 About 43 states had established government oversight (state regulation) of electric utilities, requiring reliability and the obligation to serve from utilities, and giving right to recover reasonable return from the rate base on their investments, contributing to perspective that utility stocks were good for retirement. • 1920, Congress established the Federal Power Commission (FPC) to coordinate hydroelectric projects under federal control. • 1927 In US, 75,400 MWhr sold, from 5700 MWhr in 1907 • Equipment manufacturers (GE) started holding companies that would buy and manage many operating companies, offering them equipment and services that they could not afford themselves, & establishing interconnections between them. Potomac Electric Power Co.power station near Washington DC, 1939
Evolution of Electric Industry • 1927 There were 4400 operating companies, 180 holding companies; top holding companies in pyramids often overcharged subsidiary (operating) companies. • 1929 Stock market crash caused loss among holding companies; a few survived • 1932 Only 8 holding companies owned 75% of the operating companies, & they were exempt from state regulation since their business crossed state boundaries. • 1932 FDR elected on promise to reform the industry of “the Ishmaels and the Insulls, whose hand is against everyman's.” • 1935 Investor-owned utilities (IOUs) resisted supplying rural areas on grounds it would not be profitable. So US Rural Electrification Administration created to facilitate creation of municipals and co-operatives in rural areas. • 1935 Public Utility Holdings Company Act (PUCHA) • Broke up layered interstate holding companies; allowed 1 level above operating company; required them to divest holdings that were not within a single circumscribed geographical area; reduced existing monopoly power. • Required companies to engage only in business essential for the operation of a single integrated utility, and eliminated non-utility generators (NUGs-didn’t want companies moving into other areas); reduced future monopoly power. • Required companies to register with Security & Exchange Commission (SEC)
Evolution of Electric Industry • 1938-1964: Golden years! • Holding companies declined from 216 to 18. • Generator max plant efficiencies increased from ~20% to ~40%. • Generation max size increased from ~110 MW to ~1000 MW. • Transmission typical voltage increased from mostly 60 kV to 230, 345, and 500 kV. • Load grew at ~8%/year, doubling every 10 years. • Price declined at 50 cents/kWhr to 10 cents/kWhr. • Grow and build! • 1964 About 77% electric energy from IOUs and 23% from municipals, co-ops, and government (e.g., WAPA, BPA, TVA). 45,000 Kilovolt-ampere waterwheelfor Tennessee Valley Authority(foreground), c.1938
Evolution of Electric Industry • 1965, 5:27 pm, Nov 9: Northeast Blackout, 20000 MW lost, 80,000 people interrupted in northeast US, including NYC. • 1968 North American Electric Reliability Corporation (NERC) created.
“the moral equivalent of war.” Evolution of Electric Industry • 1970 Technical limits to economies of scale and to plant efficiencies, aversion to coal due to cheap petroleum and nuclear, & OPEC. • 1973 Energy Crisis • 1977 Department of Energy (DOE) created to address US policies regarding energy and safety in handling nuclear material • 1977, FPC changed to FERC (regulates transmission and wholesale markets for interstate commerce). . Schweppe initially called it “homeostatic control,” The word homeostasis combines forms of homeo, "similar," and stasis, "standing still," yielding "staying the same." • 1978, Airline industry deregulated • 1978 Public Utility Regulatory Policies Act (PURPA): utilities had to interconnect, buy, at avoided cost from qualifying facilities (small power producers using 75% renewables or cogeneration). • 1978: Fred Schweppe at MIT proposed “spot pricing” of electricity • 1979 Three-mile island accident. • 1987 Non-utility generation grows MAJOR QUESTION: Are electric utilities natural monopolies?
Evolution of Electric Industry • 1992 Electric Policy Act • Exempt Wholesale Generators: class of unregulated generators of any technology, utilities did not have to buy their energy. • But utilities did have to provide transportation (wheeling) for wholesale transactions; no rules were specified regarding transmission service price. The 1992 EPA motivated by price disparity throughout the US. Large industrials were hungry for lower prices. 2006 1992
Evolution of Electric Industry • 1996 FERC Orders 888, 889, required IOUs to • file nondiscriminatory transmission tariffs • pay tariffs for transmission service for their own wholesale transactions • maintain an information system that gives equal access to transmission information (OASIS) • functionally unbundle their generation from “wires” • FERC order did not specify how; can be done via divestiture or “in-house” • Major outages: WSCC (’96,’97), Bay area (‘98), NY (‘99), Chicago (‘00) • 1997: Startup of 21 OASIS nodes across US • 1998 (April) California legislation gave consumers right to choose supplier • 1999 (June) 1% residential, 3% small commercial, 6% commercial, 21% large industrial, 3% agricultural have switched providers in California • 2000 (Jan) 13.8% of total load switched in Cal • 1996-2002: Independent System Operators begin: PJM, ISO-NE, ERCOT, CALISO, NYISO, MISO, SPP. ISOs own no transmission but are responsible for operating and planning the grid, and operating electricity markets. Most ISOs also obtained RTO status (see next slide).
Transmission and System Operator G G G G G G G G G G G G Independent System Operator G Transmission Operator Transmission Operator Transmission Operator G Today G G Vertically Integrated Utility 1900-199?
Evolution of Electric Industry • 2000 FERC Order 2000 formalized operating, planning, market functions and also required significant regional size to become a regional transmission organizations (RTO). US ISOs subject to FERC jurisdiction (not ERCOT) that satisfy a list of requirements become RTOs. • 2000-2001 California energy crisis • Drought, hot weather, outaged generation, natural gas shortage, transmission bottlenecks, flawed market design allowing price manipulation by some companies, problematic political forces • 2001, April PG&E went bankrupt • 2001, November Enron collapse(www.investopedia.com/updates/enron-scandal-summary/) • 2002 FERC standard market design issued. • 2003 Major blackout in the northeast US
Evolution of Electric Industry • 2004, First large wind farm in Iowa (160.5MW Intrepid plant in NW Iowa) • 2005, National Energy Policy Act: Quotas on ethanol, $$ for clean coal R&D, large incentives to build nukes, repeals PUCHA (SEC authority to FERC). • 2006, “An inconvenient truth” (Al Gore) about global warming “The effects of global warming on temperature, precipitation levels, and soil moisture are turning many of our forests into kindling during wildfire season.” 7//24/18, Union of Concerned Scientists, www.ucsusa.org/global-warming/science-and-impacts/impacts/global-warming-and-wildfire.html#.XD4ZYlxKg2w
Evolution of Electric Industry • 2008, Economic depression, Obama elected • 2009, In response to depression Obama initiated the American Recovery and Reinvestment Act of 2009, which included $80B “energy money” as follows: • $3.4B for smart grid investment • Launched the Advanced Research Projects Agency (ARPA-E) to fund innovative energy concepts • Imposed new efficiency standards for home appliances • Imposed fuel efficiency policies for cars • Increase production of biofuels • Required reporting of greenhouse emissions by power plants • 2010, Obama proposed an energy security plan to reduce offshore energy need • 2011, Obama state of union: 80% of US electricity from clean sources by 2035 • 2015, Obama’s EPA: Clean Power Plan to lower power plant CO2 emissions • 2016, 2/3 electric utilities support CPP, but congressional & legal pushback abounds • 2016, Trump elected • 2017, US withdraws from Paris Agreement • 2018, Trump proposes Affordable Clean Energy Rule, giving CO2 authority to states
Railway Integrated Electric Energy Systems ELECTRIC TRANSMISSION GAS TRANSMISSION Gas pipeline RAILWAY FOR COAL SHALE GAS PLAYS
The grid: High-level view Hydro CT or CC Distributed generation (rooftop solar) Coal Nuclear Wind Utility solar PV
Real power (watts), is ability to do work, light a bulb P=3VIcosθ V or I V or I • Reactive power (vars), does no work, but anything with a winding (motor) must have them. Time Time Q=3VIsinθ DC (batteries) AC (wall outlet) Power System Basics • Current (amperes), is like water flow • Voltage (volts), is like water pressure • Resistance (ohms), is like 1/pipe diameter: I=V/R • Electricity is either DC or AC
Power System Basics AC voltages can be easily changed from one level to another using power transformers. Power generation occurs at low voltages (<30,000 volts) because of insulation requirements. Power transmission occurs at high voltages (69,000 to 765,000 volts) to minimize current for given power transfer capability and thus minimize losses in wires. Power distribution occurs at low voltages (≤34,500 volts) for safety reasons So power systems are mainly AC because of ability to easily transform AC voltages from low levels in the generators to high levels for transmission and back to low levels for distribution and usage.
X X N S X 3-phase Power System Generation & Transmission • Power circuits can be single-phase or 3-phase N S X Single phase • Generation & transmission is always 3-phase because • Gives the same power but requires 3 wires instead of 6 • Power is constant and large motors run smoother
GENERATION DISTRIBUTION TRANSMISSION SUBSTATIONS TRANSFORMERS
US Electric Transmission & Control System Balancing authorities (the circles): They all perform power balancing. And they all have energy control centers. CAISO, ERCOT, SPP, MISO, PJM, NYISO, and ISONE also operate markets. US Transmission System: 69, 115, 138, 161, 230, 345, 500, 765 kV and HVDC (mostly ±500kV)
Remote terminal unit Substation SCADA Master Station Communication link Energy control center with EMS EMS alarm display EMS 1-line diagram
Energy Control Centers Energy Control Center (ECC): • SCADA, EMS, operational personnel • Eyes & hands of the power system Supervisory control & data acquisition (SCADA): • Supervisory control: remote control of field devices, including gen • Data acquisition: monitoring of field conditions • SCADA components: • Master Station: System “Nerve Center” located in ECC • Remote terminal units: Gathers data at substations; sends to Master Station • Communications: Links Master Station with Field Devices, telemetry is done by either leased wire, PLC, microwave, or fiber optics. Energy management system (EMS) • Topology processor & network configurator • State estimator and power flow model development • Automatic generation control (AGC), Optimal power flow (OPF) • Security assessment and alarm processing 28
Balancing Systems ENERGY BUY BIDS DAY-AHEAD MARKET 1 sol/day gives 24 oprtingcdtns ENERGY & RESERVE SELL OFFERS REQUIRED RESERVES ENERGY BUY BIDS REAL-TIME MARKET 1 sol/5min gives 1 oprtngcdtn ENERGY & RESERVE SELL OFFERS REQUIRED RESERVES NETWORK AUTOMATIC GENERATION CONTROL SYSTEM FREQUENCY DEVIATION FROM 60 HZ 29
www.misoenergy.org/LMPContourMap/MISO_All.html $17.78 $30.14 $29.18 $28.22 $69.70 1:10 pm, Monday August 22, 2016 30
Power systems: What can go wrong? • Lightning
Power systems: What can go wrong? • Lightning • Natural events (wind & snow, earthquakes, wildfires…) the weather man said light snow showers! hurry up, I can’t hold it much longer
Mon 3 Feb 2003:- no electricity for 70% of Indian state of Bihar it was the wrong sort of snow!
Power systems: What can go wrong? • Lightning • Natural events (wind and snow, earthquakes, wildfires…) • Deterioration (insulation failure) golf will never be the same again
Time for a nap? Power systems: What can go wrong? • Lightning • Natural events (wind and snow, earthquakes, wildfires…) • Deterioration (insulation failure) • Animals (mainly squirrels & snakes, but sometimes….)
46,000 volts travel through the crane and beneath the concrete road. Power systems: What can go wrong? • Lightning • Natural events (wind and snow, earthquakes, wildfires…) • Deterioration (insulation failure) • Animals (mainly squirrels & snakes, but sometimes….) • Vehicles and construction (accidents) Crane contacts overhead power line during freeway construction.
I hope you switched it off! Power systems: What can go wrong? • Lightning • Natural events (wind and snow, earthquakes, wildfires…) • Deterioration (insulation failure) • Animals (mainly squirrels & snakes, but sometimes….) • Vehicles and construction (accidents) • Mistakes during maintenance
Power systems: What can go wrong? • All of the previous situations cause faults. • Faults are dangerous situations that can hurt people and destroy equipment. • Protection equipment removes faults: • Fuses detect faults and melt a wire. Must be replaced. • Relays detect faults and signal circuit breaker to trip. • Circuit breakers open lines. Can be re-used. don’t touch the stick!
Blackouts Summary of well-known blackouts
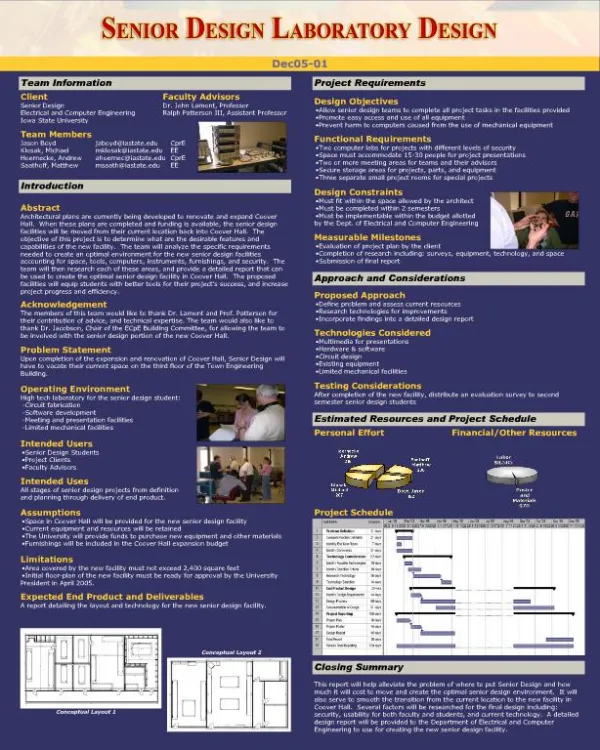
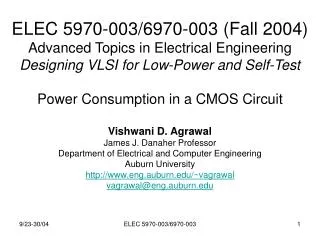
1. 12:05 Conesville Unit 5 (rating 375 MW) 2. 1:14 Greenwood Unit 1 (rating 785 MW) 3. 1:31 Eastlake Unit 5 (rating: 597 MW) INITIATING EVENT 4. 2:02 Stuart – Atlanta 345 kV 5. 3:05 Harding-Chamberlain 345 kV 6. 3:32 Hanna-Juniper 345 kV 7. 3:41 Star-South Canton 345 kV 8. 3:45 Canton Central-Tidd 345 kV 9. 4:05 Sammis-Star 345 kV SLOW PROGRESSION WHAT HAPPENED ON AUGUST 14, 2003???
1. 12:05 Conesville Unit 5 (rating 375 MW) 2. 1:14 Greenwood Unit 1 (rating 785 MW) 3. 1:31 Eastlake Unit 5 (rating: 597 MW) INITIATING EVENT 4. 2:02 Stuart – Atlanta 345 kV 5. 3:05 Harding-Chamberlain 345 kV 6. 3:32 Hanna-Juniper 345 kV 7. 3:41 Star-South Canton 345 kV 8. 3:45 Canton Central-Tidd 345 kV 9. 4:05 Sammis-Star 345 kV SLOW PROGRESSION 10. 4:08:58 Galion-Ohio Central-Muskingum 345 kV 11. 4:09:06 East Lima-Fostoria Central 345 kV 12. 4:09:23-4:10:27 Kinder Morgan (rating: 500 MW; loaded to 200 MW) 13. 4:10 Harding-Fox 345 kV 14. 4:10:04 – 4:10:45 20 generators along Lake Erie in north Ohio, 2174 MW 15. 4:10:37 West-East Michigan 345 kV 16. 4:10:38 Midland Cogeneration Venture, 1265 MW 17. 4:10:38 Transmission system separates northwest of Detroit 18. 4:10:38 Perry-Ashtabula-Erie West 345 kV 19. 4:10:40 – 4:10:44 4 lines disconnect between Pennsylvania & New York 20. 4:10:41 2 lines disconnect and 2 gens trip in north Ohio,1868MW 21. 4:10:42 – 4:10:45 3 lines disconnect in north Ontario, New Jersey, isolates NE part of Eastern Interconnection, 1 unit trips, 820 mw 22. 4:10:46 – 4:10:55 New York splits east-to-west. New England and Maritimes separate from New York and remain intact. 23. 4:10:50 – 4:11:57 Ontario separates from NY w. of Niagara Falls & w. of St. Law. SW Connecticut separates from New York, blacks out. FAST PROGRESSION (cascade) WHAT HAPPENED ON AUGUST 14, 2003???
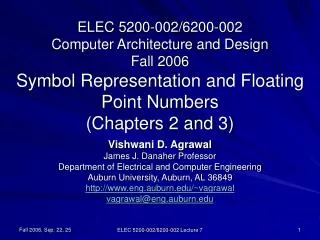
Immediate causes of the 8/14/03 blackout 1:30 Loss of East Lake generator (over-excitation) 2:02 Loss of Stuart-Atlanta (tree contact) 2:02 MISO system model becomes inaccurate 2:14-3:08 Loss of software in FE control center 3:05 Loss of Harding-Chamberlain (tree contact) 3:32 Loss of Hanna-Juniper (tree contact) 3:41 Loss of Star-S.Canton (tree contact) 4:06 Loss of Sammis-Star (high overload looked like fault to “zone 3” of the protection system)
Why so much tree-contact? • Trees were overgrown because right-of-ways had not been properly maintained. • Lines expand and sag due to heat; more prone in summer with high temperature & low winds; more prone with high current. • Each successive line trip requires that the power it was carrying be transferred to flow elsewhere, resulting in increased power on remaining lines.
Another influence: insufficient reactive power Another contribution to the blackout was insufficient reactive power in the Cleveland area, i.e., the reactive power (vars) in the Cleveland area generation was insufficient to meet the reactive power demand of its motors. Conditions that make a system prone to this include: • High load, especially induction motors (air conditioners) • Loss of generation in load-intensive area and/or loss of transmission into that load-intensive area This results in voltage decline in the load-intensive area, and because P~VI, when voltage V declines, current I must increase in order to maintain the same power P. When I goes up, lines load up more heavily.