Download
1 / 29
290 likes | 382 Views
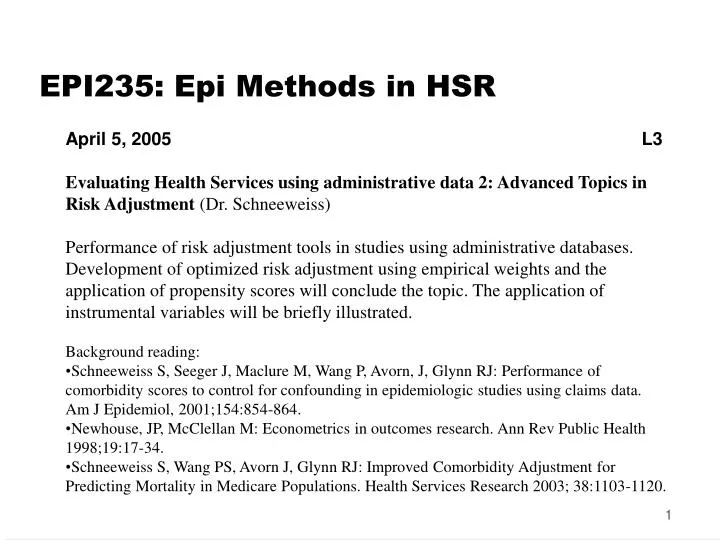
EPI235: Epi Methods in HSR. April 5, 2005 L3 Evaluating Health Services using administrative data 2: Advanced Topics in Risk Adjustment (Dr. Schneeweiss)

E N D
EPI235: Epi Methods in HSR • April 5, 2005 L3 • Evaluating Health Services using administrative data 2: Advanced Topics in Risk Adjustment (Dr. Schneeweiss) • Performance of risk adjustment tools in studies using administrative databases. Development of optimized risk adjustment using empirical weights and the application of propensity scores will conclude the topic. The application of instrumental variables will be briefly illustrated. • Background reading: • Schneeweiss S, Seeger J, Maclure M, Wang P, Avorn, J, Glynn RJ: Performance of comorbidity scores to control for confounding in epidemiologic studies using claims data. Am J Epidemiol, 2001;154:854-864. • Newhouse, JP, McClellan M: Econometrics in outcomes research. Ann Rev Public Health 1998;19:17-34. • Schneeweiss S, Wang PS, Avorn J, Glynn RJ: Improved Comorbidity Adjustment for Predicting Mortality in Medicare Populations. Health Services Research 2003; 38:1103-1120.
Data from British Columbia • 141 161 BC residents 65 years or older • 1-year baseline period (4/95 - 4/96) • 6 comorbidity scores • Utilization measures • 1-year follow-up (4/96-4/97) • Mortality • Hospitalizations (binary) • Visits, Expenditures (continuos, annualized)
Spearman Correlations at Baseline Rx-based Dx-based
Performance: 1-year mortality Schneeweiss et al. Am J Epidemiol 2001
Predictive validity and control for confounding • The apparent Relative Risk of an exposure-outcome relation can be expressed as RRapp = f (RRtrue, Pr(C), Pr(E), OREC, RRCO). • Bias in % = {(RRapp - RRtrue)/RRtrue} * 100
C OREC RRCO E Outcome RRtrue = 1 Schneeweiss et al. Am J Epidemiol 2001
Conclusions • ICD-9 based scores (Romano) perform better than Pharmacy based scores for a wide range of outcomes • A measure as simple as the number of distinct prescription medications out-performs some scores • We recommend to combine Romano with the number of distinct prescription medications • Predictive performance translates into the capacity to control bias.
Generalizability? • Caution when generalizing performance to other populations especially to patients with specific conditions • However, ranking of scores may be generalizable to a larger extent
Ranking is preserved across 4 populations of elderly beneficiaries Schneeweiss et al. JGIM 2004
Can we Improve Scores? • To what extend can the performance of comorbidity scores be improved using specific weights for elderly populations using claims data?
Subjects • 235,881 NJ Medicare enrollees with drug coverage through Medicaid or PAAD. • Continuous beneficiary throughout 1994
Two Comorbidity Indicators: • 1-year baseline period (1/94 - 12/94) • Charlson score (Romano’s algorithm) • Chronic Disease Score (von Korff’s algorithm) • 1-year mortality during follow-up year (1/95-12/95) Study Outcome:
Measure of Improved Performance • Performance of prediction: • Area under the ROC curve • Percent improvement of prediction beyond chance Sensitivity AUC = .8 % improvement: (0.8-0.7) / (0.7-0.5) = 50% AUC = .7 AUC = .5 1 - Specificity
Results Schneeweiss et al. Health. Serv. Res., 2003
The Next Level? • Individualized „Summary Risk Scores“ (Ray e.g. 2002) • Multivariate Confounder Scores • Miettinen 1976 • Pike, Anderson 1979 • Cook, Goldman 1989 • = Disease Risk Score (DRS)
Reasons for Data Reduction??? • 1. • 2. • 3.
IV estimation • Good IVs are rare • Geographic variation • Distance to (specialty) provider (McClellan JAMA) • Turning 65 • Physician preference (Brookhart, 2006; Schneeweiss 2007) • ?
Overview Can adjust UNmeasured confounders? Improves efficiency?