Download
1 / 14
290 likes | 966 Views
Watershed Analysis. Tamara Doucette 3.27.08 Advanced GIS. Watersheds General Info. John Wesley Powell:

E N D
Watershed Analysis Tamara Doucette 3.27.08 Advanced GIS
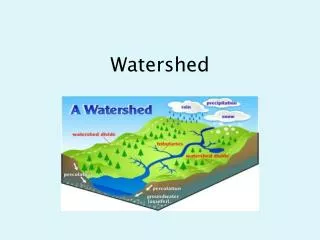
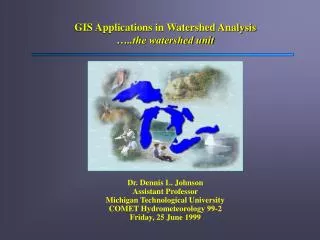
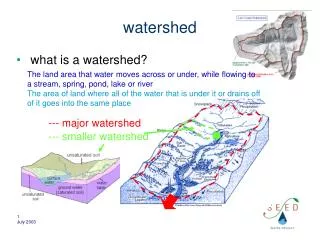
WatershedsGeneral Info • John Wesley Powell: • ”…that area of land, a bounded hydrologic system, within which all living things are inextricably linked by their common water course and where, as humans settled, simple logic demanded that they become part of a community.” • AKA: Basin, catchment, • contributing area • Charlottesville: Rivanna Watershed
Watersheds in GIS • Watershed tool output: • Total area flowing to a given outlet (pour point) • Pour point: point at which water flows out of an area • Lowest point in a watershed • Cells in the source raster are used as pour points • May be any feature for which you want to determine the contributing area (dam, stream guage, etc)
Applications • Environmental science • Ecology • Urban planning • Biology • Policy • Geopolitical boundaries • Hydrology • Watershed-based water source management
What to use? • HYDROTools • Free script • Extension for ArcView 3.x • ArcGIS Hydro model • Originally developed in 1980’s • Originators: University of Maryland Department of Civil and Environmental Engineering, Maryland State Highway Administration • Title: GIS Hydro • Provider: University of Maryland Department of Civil and Environmental Engineering • URL: http://www.gishydro.umd.edu/
Steps in ArcGIS • Input file: Elevation raster or DEM • All tools found in Spatial Analysis > Hydrology
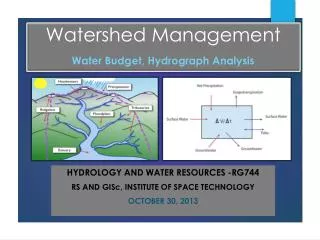
Steps in GIS • Use DEM as input into Flow Direction tool • Direction in which water would flow out of each cell is determined • Output is integer raster w/ values from 1-255 • TIP: Spatial Analysis extension needs to be activated
Steps in GIS • Sink Function • Any sinks in original DEM are identified • Sink = incorrect value lower than the value of its surroundings • Problematic because any water that flows into them cannot flow out • Correct by filling with Fill Tool
Steps in GIS • Flow Accumulation • Calculate the number of upslope cells flowing to a location • Input: output from Flow Direction tool • Set threshold for streams with Con tool • (Ex: cells w/ >100 cells flowing to them will be included) • Pour points= junctions of stream network derived from flow accumulation
Steps in GIS • Snap Pour Point • Ensures selection of points of high accumulated flow when delineating watersheds • Searches within a snap distance around the specified pour points for the cell of highest accumulated flow • Input • Input raster/pour point feature data • Flow accumulation raster file • Snap distance • Output = integer raster
Steps in GIS • Watershed Tool • Input • Flow direction raster • Pour point location raster or feature dataset • Must specify if data is raster or feature • Output • Watershed raster
Additional Tools • Further Watershed Analysis Tools: • Stream Order • Shreve or Strahler techniques • Flow Length • Useful for calculating travel time of water through a watershed
Sources • http://webhelp.esri.com/arcgisdesktop/9.2/index.cfm?TopicName=How%20Watershed%20works • http://webhelp.esri.com/arcgisdesktop/9.2/index.cfm?id=4743&pid=4733&topicname=Hydrologic_analysis_sample_applications • http://repositories.cdlib.org/cgi/viewcontent.cgi?article=1016&context=jmie/ice