Download
1 / 34
340 likes | 355 Views
Analyze and display water-related statistics to understand the global water crisis, its impact on ecological integrity, human health, and security. Learn how to collaborate inclusively and present complex quantitative information.

E N D
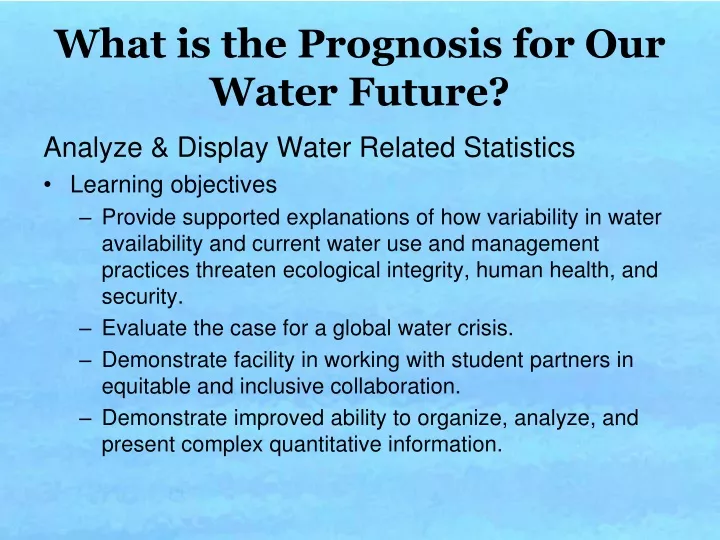
What is the Prognosis for Our Water Future? Analyze & Display Water Related Statistics • Learning objectives • Provide supported explanations of how variability in water availability and current water use and management practices threaten ecological integrity, human health, and security. • Evaluate the case for a global water crisis. • Demonstrate facility in working with student partners in equitable and inclusive collaboration. • Demonstrate improved ability to organize, analyze, and present complex quantitative information.
What is the Prognosis for Our Water Future? Are we sliding into a ?
Some Alarming Water Stats • More than one billion peoplelack access to a safe supply of drinking water. • Water-related diseases are the leading cause of death in the world, killing 10,000-20,000 people per day. Kills 1.4 million children/year. Responsible for 80%of sickness. • More than 200 million hours are spent each day by women and female children to collect water from distant, often-polluted sources. http://water.org/water-crisis/water-sanitation-facts/ http://www.wix.com/emeraldibis/water-sustainability
Some Alarming Water Stats • By 2025 it is estimated that at least 40% of the world’s 7.2 billion people will live in countries with insufficient water to meet their agricultural, industrial, ecological, and human health needs. • By the middle of the century that number could climb to 7 billion in 60 countries – more people than live in the world today. • Half of the world’s wetlands have disappeared over the last century, with some rivers now no longer reaching the sea, and over 20% of the estimated 10,000 freshwater fish species are now endangered or extinct.
Two Primary Water Issues • Quantity • Too little • Or it is just not getting to where it is needed
Two Primary Water Issues • Quantity • Too little • Too much Flooding events becoming more frequent and severe
Two Primary Water Issues • Quantity • Too little • Too much • Quality • “Fresh” vs. saline
Two Primary Water Issues • Quantity • Too little • Too much • Quality • “Fresh” • Potable
Two Primary Water Issues • Quantity • Too little • Too much • Quality • “Fresh” • Potable or not Are quantity and quality connected?
What Are the Impacts of Civilization on Water? People Water
What Are the Impacts of Civilization on Water? People Water and Vice Versa
What should we focus on? Where should we intervene?
Global Water Use Projections Water withdrawal = water that is withdrawn from a surface or groundwater source. Water consumption = water that is permanently withdrawn from its source. The difference is water that goes back to the source and is relatively untainted.
What Are Human Water Requirements? • Minimum Drinking Water Requirement • 5 liters per person per day • Basic Requirements for Sanitation • 20 liters per person per day • Basic Water Requirements for Bathing • 15 liters per person per day • Basic Requirement for Food Preparation • 10 liters per person per day • 50 liters per person per day (18.3 m3/yr)
Haves vs. Have-Nots Water Rights and Wrongs, UNHDR Youth Booklet, November 2006 p.16
Water Stress Freshwater availability < 1,700 m3/person/yr Water Scarcity Freshwater availability < 1,000 m3/person/yr Not just for domestic use. How else is the extra water being used?
Geography of Water Stress Percent of population with access
The Haves and the Have-NotsHow is it possible to withdraw > 100% of your renewable water resources? Statistics from Aquastat http://www.fao.org/nr/water/aquastat/data/query/index.html?lang=en Looking pretty good for the U.S.A., right? But…
Take home point alert! • Statistics like these average out variability over very large areas. • Nobody lives in global or national average land.
Geography of Water Stress WaSSI = Water Supply Stress Index WD = Water Demand WS = Water Supply Red = Demand exceeds Supply
Geography of Water Stress Physical vs. Economic Water Scarcity What is economic water scarcity?
Geography of Water Stress Human Water Security Threat Takes into account impacts of pollution on water quality and use.
Impact on Water Security Threat from Technological Investments Note how the water stress threat diminishes in Europe (and the US) due to assumed investments while it actually increases relatively in sub-Saharan Africa
Now Superimpose on All of This… • Climate Change
Looking Forward: Climate Change Impacts Health Weather-related mortality Infectious diseases Air-quality respiratory illnesses Agriculture Crop yields Irrigation demands Pest outbrreaks Climate Changes Forests Change in forest composition Shift geographic range of forests Forest health and productivity Pest outbreaks Temperature Precipitation Water Resources Changes in water supply Water quality Increased competition for water Sea Level Rise Coastal Areas Erosion of beaches Inundation of coastal lands Costs to protect coastal communities Species and Natural Areas Shift in ecological zones Loss of habitat and species Source: EPA