Download
1 / 27
270 likes | 410 Views
Mean & Variance. Dr. C. Hsieh College of Informatics Kao yuan University. ● 母體 , 群體 (Population): 研究者所欲研究的全部對象所成之集合 樣本 (Sample): 母體的部分集合 ● 參數 , 母數 (Parameter): 描述母體的特徵量數 統計量 (Statistic): 描述樣本的特徵量數. 抽樣 (Sampling). Population. Sample. Parameter. Statistic.

E N D
Mean & Variance Dr. C. Hsieh College of Informatics Kao yuan University
● 母體,群體(Population): 研究者所欲研究的全部對象所成之集合 樣本(Sample): 母體的部分集合 ● 參數,母數(Parameter): 描述母體的特徵量數 統計量(Statistic): 描述樣本的特徵量數
抽樣(Sampling) Population Sample Parameter Statistic Population size N Sample size n 推論(inference)
觀測值(Observations): X1 , X2 , …, Xn 有序統計量(Order Statistics): X(1) , X(2) ,…, X(n) ● 位置量數(Location measures), 集中趨勢量數(Measures of central tendency) ● 差異量數(Dispersion measures)
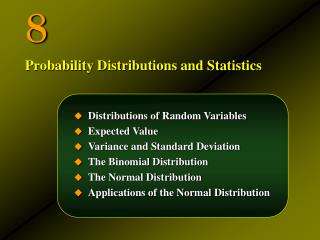
用統計數字說話 • 描述資料中心(center)位置的統計數字: • 平均數(mean) • 中位數(median) • 描述資料分散(spread)程度的統計數字: • 四分位(quartiles) • 四分位間距(Interquartile range) • 標準差(standard deviation)
平均數(mean) • 所有資料加總除以資料個數即為平均數。 • n筆資料分別為x1, x2, …, xn則均數為 • 簡記為
中位數(median) • 將所有資料由小到大排序後,排在最中間的數,稱為中位數,記為M。 • n筆資料的中位數 • 若 n 為奇數,則排序第(n +1)/2為中位數。 • 若 n 為偶數,則排序第 n /2與第 n/2 +1的平均數為中位數。
平均數與中位數的比較 • 對稱資料 • 平均數與中位數的數字相當。 • 偏斜資料(skewed data) • 左偏斜資料(skewed to the left): • 中位數在平均數的右邊,即中位數大於平均數。 • 右偏斜資料(skewed to the right): • 中位數在平均數的左邊,即中位數小於平均數。
四分位數(quartiles) • 將所有資料由小到大排序後, • 排在前面 ¼ 位置的數,稱為第 1 四分位數,記為Q1。 • Q1也可視為前半資料的中位數。 • 排在前面 ¾ 位置的數,稱為第 3 四分位數,記為Q3。 • Q3也可視為後半資料的中位數。 • 四分位間距(inter-quartile range)
例題1.9 • Mark McGwire 的全壘打數: (偶數) • 9 9 22 32 33 39 39 42 49 52 58 70 • Q1 M Q3 • Babe Ruth 的全壘打數: (奇數) • 22 25 34 35 41 41 46 46 46 47 49 54 54 59 60 • Q1 M Q3
五數總結與盒形圖 • 五個重要敘述性統計量,最小值、第1 四分位數、中位數、第3 四分位數及最大值又稱為五數總結(five-number summary)。 • 軟體多可算出五數總結的資料。 • 盒形圖(boxplot)將資料的五數總結,以圖形呈現出來。
● 位置量數: 1.平均數(Mean) (統計量) (參數) 2.中位數(Median) 3.眾數(Mode)
4.百分位數(Percentile) 第 k 百分位數(k-th Percentile) where Note: 10. Sample size n=50
20. P50=Md 30. 四分位數(Quartile) Q1= P25 , Q2= P50=Md, Q3= P75 40. 十分位數(Deciles) D1= P10 , D2= P20 , … , D9= P90
● 差異量數 1.全距(Range) R=X(n) - X(1) 2.四分位距(Interquartile-range) IQR=Q3 - Q1 3.四分位差(Quartile deviation) Q.D.=IQR/2(=Q2 - Q1=Q3 - Q2,對稱資料)
4.平均絕對偏差(Mean Absolute Deviation) 5.變異數(Variance) , 6.標準差(Standard Deviation) (統計量) (參數)
樣本數 平均數 標準差 C.V. 成人 160 57.0 11.0 19.3% 小孩 18 5.6 1.4 25.0% 7.變異係數(Coefficient of Variation) (統計量) (參數) 例1. 成人 v.s. 小孩之體重
平均數 標準差 C.V. 身高 120 15 12.5% 體重 25 5 20.0% 例2. 某一群小孩之身高、體重 如下表
標準差(Standard Deviation)與變異數(Variance) n筆資料分別為 x1, x2, …, xn,則定義變異數為 簡記為 標準差 s 則為變異數 s2 的平方根
標準差與變異數實例 • 例題1.10:7位受試者的新陳代謝率,每24小時消耗卡路里數,資料如下: • 1792, 1666, 1362, 1614, 1460, 1867, 1439 • 平均數為 1600卡路里。 • 變異數為 s2= 35,811.67。 • 標準差為 s = 189.24 卡路里。
離差(deviation)圖示 x = 1439 x = 1792 離差= -161 離差= 192 1400 1500 1600 1700 1800 1900 1300
離差值與自由度 • n筆資料對均值的差稱為離差值,即 • 因為 n個離差值的總和必為零, • 所以第n個離差值,可由前面 n- 1個離差值來決定。我們稱離差值有n- 1個自由度 (degrees of freedom)。
標準差的運用 • 平均數 被選為度量中心時,標準差s可度量平均值的離散度。 • 所有的資料都一樣時,s = 0,沒有離散度。其他情形 s都大於零。 • 觀測值離平均數越遠時,s就越大。 • s與 和原有的觀察值有相同的單位。 • 高度偏斜或少數離群值會使s變很大。