Download
1 / 38
380 likes | 400 Views
Explore UW's west-wide hydrologic system, evaluating climate forecasts, assimilation strategies, hydrologic modeling, and downscaling approaches to improve predictability and reliability. Utilize multi-model ensembles for accurate seasonal forecasts.

E N D
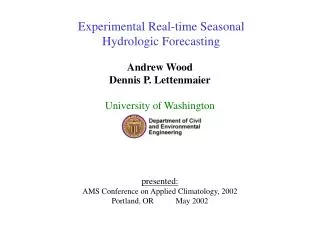
An experimental real-time seasonal hydrologic forecast system for the western U.S. Andrew W. Wood and Dennis P. Lettenmaier Department of Civil and Environmental Engineering University of Washington Climate Diagnostics and Prediction Workshop Pennsylvania State University October 27, 2005
Outline • Background – UW West-wide hydrologic forecasting system • Preliminary multi-model ensemble work • Final Comments
Background: UW west-wide system • where did it come from? 1997 COE Ohio R. basin/NCEP -> -> UW East Coast 2000 (NCEP/ENSO) -> -> UW PNW 2001 -> UW west-wide 2003 • what are its objectives? • evaluate climate forecasts in hydrologic applications • seasonal: CPC, climate model, index-based (e.g., SOI, PDO) • 16-day: NCEP EMC Global Forecast System (GFS) • evaluate assimilation strategies • MODIS snow covered area; AMSR-E SWE • SNOTEL/ASP SWE • evaluate basic questions about predictability • evaluate hydrologic modeling questions • role of calibration, attribution of errors, multiple-model use • evaluate downscaling approaches • what are its components?
Surface WaterMonitor daily updates 1-2 day lag soil moisture & SWE percentiles ½ degree resolution archive from 1915-current uses ~2130 index stns
soil moisture snowpack streamflow, soil moisture, snow water equivalent, runoff local scale (1/8 degree) weather inputs INITIAL STATE Hydrologic model spin up Hydrologic forecast simulation NCDC met. station obs. up to 2-4 months from current LDAS/other real-time met. forcings for spin-up gap ensemble forecasts ESP traces (40) CPC-based outlook (13) NCEP CFS ensemble (20) NSIPP ensemble (9) SNOTEL / MODIS* Update SNOTELUpdate Now 1-2 years back Month 6 - 12 Background: UW west-wide system * experimental, not yet in real-time product
Background: UW west-wide system Snowpack Initial Condition Soil Moisture Initial Condition
Background: UW west-wide system Seasonal Climate Forecast Data Sources CCA NOAA CAS OCN CPC Official Outlooks SMLR CA Coupled Forecast System CFS VIC Hydrology Model NASA NSIPP/GMAO dynamical model ESP ENSO UW ENSO/PDO
Background: UW west-wide system validation of selected historic streamflow simulations
monthly hydrographs MAP LINKS TO FLOW FORECASTS
Background: UW west-wide system Precip Temp SWE Runoff Soil Moisture Mar-05 Apr-05 May-05
Background: UW west-wide system what drives UW system activities? • research goals: • exploration of CPC & NCEP products • data assimilation of NASA products • Klamath Basin, Sacramento River (particularly Feather) • collaborations: • requests by WA State drought personnel • Yakima-basin forecasts, Puget Sound • SW Monitor type hydrologic assessment • interests of Pagano, Pasteris & Co (NWCC): • calibrated forecast points in Upper Colorado, upper Missouri R. basin, Snake R. basin • spatial soil moisture, snow and runoff data • one-off analyses • other, e.g., U. AZ project with USBR in lower Colorado basin
Background: UW west-wide system research objectives include: • climate forecasts • data assimilation • hydrologic predictability • multi-model / calibration questions
Expansion to multiple-model framework Seasonal Climate Forecast Data Sources CCA NOAA CAS OCN CPC Official Outlooks SMLR CA Coupled Forecast System CFS VIC Hydrology Model NASA NSIPP/GMAO dynamical model ESP ENSO UW ENSO/PDO
LDAS models An LDAS intercomparison conclusion: Model results, using default parameters, have a wide spread for some states and fluxes. Every model is doing something better than other models in some parts of the country NOAH VIC MOSAIC SAC Dag Lohmann, HEPEX
Multiple-model Framework Multiple Hydrologic Models Schaake Shuffle (Clark et al) CCA NOAA CAS OCN CPC Official Outlooks NWS SAC SMLR CA Wood et al., 2002 Coupled Forecast System (CFS) VIC Hydrology Model NASA NSIPP-1 dynamical model NOAH LSM NWS: Day et al; Twedt et al ESP Hamlet et al., Werner et al. weightings calibrated via retrospective analysis ENSO UW ENSO/PDO
Multiple-model Framework Models: • VIC - Variable Infiltration Capacity (UW) • SAC - Sacramento/SNOW17 model (National Weather Service) • NOAH – NCEP, OSU, Army, and NWS Hydrology Lab ModelEnergy Balance Snow Bands VIC Yes Yes SAC No Yes NOAH Yes No • Calibration parameters from NLDAS 1/8 degree grid (Mitchell et al 2004) – no further calibration performed • Meteorological Inputs: 1/8 degree COOP-based, 1915-2004
Test Case - Salmon River basin (upstream of Whitebird, ID)- retrospective (deterministic evaluation):25 year training 20 year validation
Individual Model Results Monthly Avg Flow Monthly RMSE
Individual Model Results • VIC appears to be best “overall” • Captures base flow, timing of peak flow • Lowest RMSE except for June • Magnitude of peak flow a little low • SAC is second “overall” • No base flow • peak flow is early but magnitude is close to observed* • NOAH is last • No base flow • peak flow is 1-2 months early and far too small (high evaporation)
Combining models to reduce error • Average the results of multiple models • Ensemble mean should be more stable than a single model • Combines the strengths of each model • Provides estimates of forecast uncertainty
Computing Model Weights • Bayesian Model Averaging (BMA) (Raftery et al, 2005) Ensemble mean forecast = Σwkfk where fk = result of kth model wk = weight of kth model, related to model’s correlation with observations during training Raftery, A.E., F. Balabdaoui, T. Gneiting, and M. Polakowski, 2005. Using Bayesian Model Averaging to Calibrate Forecast Ensembles. Monthly Weather Review, 133, 1155-1174.
Computing Model Weights • We transform flows to Gaussian domain and bias-correct them before computing weights using the BMA software • Western U.S. – many streams have 3-parameter log-normal (LN-3) distributions for monthly average flow • Each month, for each model, is given distinct distribution, transformation, bias-correction • Procedure • monthly LN-3 transformation • monthly bias correction based on regression • BMA process to calculate monthly weights, statistics • weights used to recombine models • transform outputs back to flow units
Multi-model ensemble results June September
Multi-model ensemble results June Flow, 1975-1995 September Flow, 1975-1995
Multi-model ensemble results June LN-3 & Bias-Corrected Flow, 1975-1995 Sept LN-3 & Bias-Corrected Flow, 1975-1995
Multi-model ensemble results • despite large biases, SAC had a stronger interannual correlation with observations than VIC • post-processing fixes many of the biases • BMA procedure only really uses the inter-annual signal supplied by the models
Follow-on questions • Can we infer anything about physical processes from the ensemble weights? • How will this work in the ensemble forecast context? • in gaining forecast accuracy, might we lose the physical advantages of models? • other ways of applying BMA? e.g., not monthly timestep; with different bias-correction & transformation
ongoing work RESEARCH -- RESEARCH -- RESEARCH • assimilation of MODIS & other remote sensing • climate forecast (CPC outlooks, climate model, index-based) • downscaling • shorter term forecasts (GFS-based) • multiple-model exploration • further development of SW Monitor • generally, water / energy balance questions in face of climate change / variability • HEPEX support
HEPEX western US/BC testbed Test Bed Leaders: • Frank Weber (BC Hydro, Burnaby, British Columbia, Canada) • Andrew Wood (University of Washington, Seattle, USA) • Tom Pagano (NRCS National Water and Climate Center, Portland, OR) • Kevin Werner (NWS/WR) focus: hydrologic ensemble forecasting challenges that are particular to the orographically complex, snowmelt-driven basins of the Western US and British Columbia…prediction at monthly to seasonal lead times (i.e., 2 weeks t0 12 months). snow assimilation & model calibration basins: Mica (BC), Feather (CA), Klamath (OR/CA), Yakima (WA), Salmon (ID), Gunnison (CO), others?