Download
1 / 16
160 likes | 185 Views
Delve into the complexities of regional food networks, from the concept of food-miles to freight movement dynamics. Discover the environmental impacts and benefits of local food production and distribution. Explore an online demonstration showcasing food system flows and assets. Gain insights into the movement of food-related commodities in Indiana.

E N D
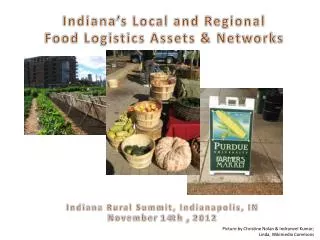
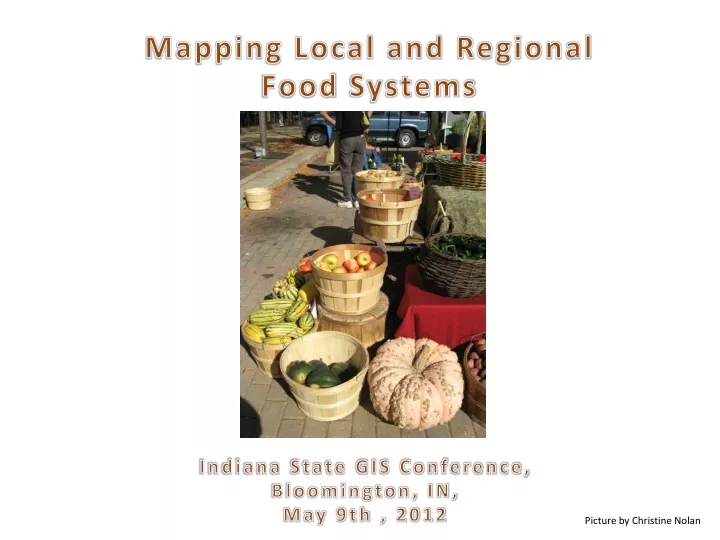
Mapping Local and Regional Food Systems Indiana State GIS Conference, Bloomington, IN, May 9th , 2012 Picture by Christine Nolan
Structure • Background • The Well Traveled Yogurt Pot • Food-miles Concept: Pros & Cons • Freight Movement, food-related commodities, USA & IN • Online Demonstration- Food System Flows and Assets
The Well Traveled Yogurt Pot Yogurt culture, paper, resin, glue Corn & Wheat powder Strawberries Labels & Plastics Jam Glass Jars Milk Source: Stefanie Böge, The Well-traveled Yogurt Pot, World Transport Policy & Practice, Vol. 1, No. 1, 1995 Map developed by the PCRD
The Well Traveled Yogurt Pot • For one truck-load of yogurt in southern Germany , a theoretical truck-load had to move 1,005 KM. • Environmental consequences- emissions of SO2, Nox, and dust • Diesel and fossil fuel expenses (non-renewable energy sources) “In general, volume of road freight (tons) is stagnating, volume of freight movement (ton-miles) is increasing”………Stefanie Böge, 1995 Source: Stefanie Böge, The Well-traveled Yogurt Pot, World Transport Policy & Practice, Vol. 1, No. 1, 1995
Food-Miles Concept • “Farm to the Fork”- distance traveled by food (Angela Paxton, 1994) • Energy used, GHG emissions, other environmental impacts • Promotes locally grown foods, local producers and farmers • The Soil Association in the UK monitors the import of organic produce to UK by the air freight • Benefits of organic farming (social and economic) versus costs (GHG emissions during production, transport by air freight, etc.) • In UK, the air freight is used for 1% of fresh organic produce causing 11% of GHG emissions of the food sector
U.S. Freight Movement • In 2007, the total value of freight moved was $ 11.7 trillion, weight was 12.5 billion tons, and movement was 3.3 trillion ton-miles • All modes are included- trucks, rail, water, air, pipeline, and multiple modes (parcel, courier, USPS, truck & rail, etc.) • Cereal grains, ranked 2nd by weight; only food-related item in the top 10 commodities in 2007 (1.5 billion tons) Source: BTS, Table 01-58, National Transportation Statistics Freight Facts & Figures, 2011
Movement of Food-related Commodities • Freight Analysis Framework 3 • Oak Ridge National Laboratory • Commodities • Freight movement by 7 modes • Truck, Rail, Water, Air, Multiple modes, Pipeline, Other modes • 7 commodities- live animals/fish, cereal grains, other ag. prod., animal feed, meat/seafood, milled grain products, other food stuffs
Online Demonstration FSNAT FIAT http://prodgis.agriculture.purdue.edu/Freight/flexviewer/index.html http://prodgis.agriculture.purdue.edu/FarmersMarket/flexviewer/index.html
Thank you! Contact: Indraneel Kumar, ikumar@purdue.edu Andrey Zhalnin, azhalnin@purdue.edu Purdue Center for Regional Development Gerald D. and Edna E. Mann Hall, Suite 266 203 Martin Jischke Drive West Lafayette, IN 47907