Download
1 / 12
120 likes | 144 Views
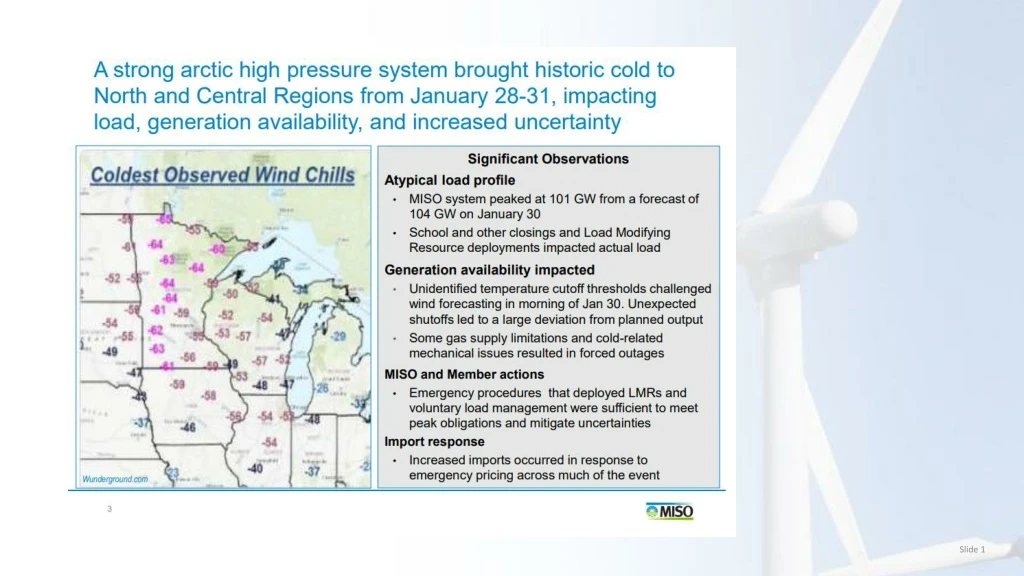
Explore the sequence of events during MISO's Max Gen Event, analyzing generation runs and emergency needs vs. market prices. Discover the impact on load management and wind generation, plus insights on MISO's fuel mix and wind capacity. Real-time data insights included.

E N D
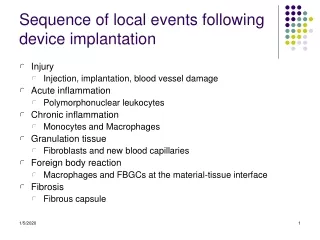
RPU and SMMPA and Operations During Event • 12 SMMPA Members ran 43 engines (up to 88 MW) for 30+ continuous hours • Natural gas curtailed for generation, WES no available gas • CCK no available gas and failed to start on oil back up • LMPs ranged from $25 to $668 per MW • Generation extended runs were driven by emergency generation needs, not market prices • Emergency driven by generation unavailability, not high loads • MISO indicated they had 5000 – 10,000 MW of gas generation curtailed • MISO-wide wind generation dropped 8500 MW during event
MISO’s actual load was below forecast during the event MISO initiated load management Max Gen 2a/b
Max Gen Event Began Max Gen Event Ended
MISO Fuel Mix Non-Event Day – Feb. 12 4:05 EST Peak Load Hour During Event 4.3% (4,024 MW) 4.3% (3,948 MW) 1.6% (1,246 MW) Total Megawatts 92,695 14.3% (10,838 MW) 12.4% (11,521 MW) 15.9% (12,054 MW) 43.8% (40,622 MW) 45.4% (34,407 MW) 35.1% (32,580 MW) 22.8% (17,301 MW) Graphs and data from MISO website and MISO presentation
MISO Wind Capacity 18,204 MW Fossil Fuel and Nuclear Online 88,707 MW Online at 0900 January 30th 2019 4,024 MW 22% 401,298 MW’s of Wind Needed to Cover Fossil and Nuclear Units
MISO Wind Capacity 18,204 MW Fossil Fuel and Nuclear Online 72,917 MW Online at 1600 February 18th 2019 771 MW 4% 1,721,636 MW’s of Wind Needed to Cover Fossil and Nuclear Units
MISO Real Time Displays https://www.misoenergy.org/markets-and-operations/real-time-displays/