Download
1 / 22
2.44k likes | 6.37k Views
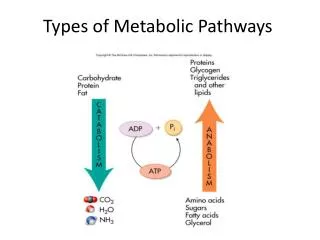
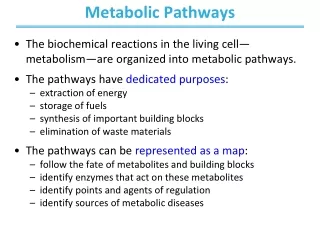
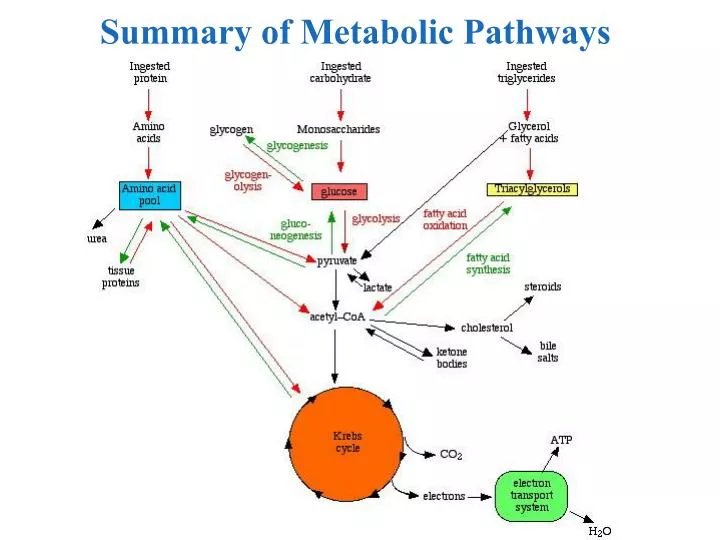
Summary of Metabolic Pathways. Metabolic Profile: Brain. Fuel(s) - glucose is prime fuel uses ~120g/day Fuel use(s) - active transport (Na + , K + ), biosynthesis Glucose uptake - transporter half-saturated at 1.6 mM normal blood glucose level ~5 mM (90mg%)

E N D
Metabolic Profile: Brain Fuel(s) - glucose is prime fuel uses ~120g/day Fuel use(s) - active transport (Na+, K+ ), biosynthesis Glucose uptake - transporter half-saturated at 1.6 mM normal blood glucose level ~5 mM (90mg%) hexokinase saturated at 0.5 mM hypoglycemic danger level 2.2 mM (40mg%) Main metabolic pathways - totally aerobic metabolism glycolysis, citric acid cycle, ETS
Metabolic Profile: Skeletal Muscle Fuel(s) - Resting muscle - fatty acids Highly-active muscle - glucose from glycogen produces lactate Fuel use(s) - contraction, active transport (Ca2+) Main metabolic pathways - Resting muscle (aerobic) fatty acid oxidation, citric acid cycle, ETS Highly-active muscle (anaerobic) glycogenolysis, glycolysis
Metabolic Profile: Heart Muscle Fuel(s) - main fuel fatty acids Fuel use(s) - contraction, active transport (Ca2+) Main metabolic pathways - totally aerobic metabolism fatty acid oxidation, citric acid cycle, ETS
Metabolic Profile: Adipose Tissue Fuel(s) - major fuels glucose, fatty acids Fuel use(s) - biosynthesis of triacylglycerols, fatty acid synthesis (high blood glucose) Main metabolic pathways - glycolysis, fatty acid oxidation, citric acid cycle, ETS, triacylglycerol synthesis, lipolysis,
Metabolic Profile: Kidney Fuel(s) - major fuels glucose, fatty acids Fuel use(s) - active transport, biosynthesis (glucose) Main metabolic pathways - Normal conditions - glycolysis, fatty acid oxidation, citric acid cycle, ETS During starvation - gluconeogenesis
Fuel(s) - major fuel fatty acids Fuel use(s) - biosynthesis of glucose, fatty acids, glycogen, triacylglycerols, cholesterol, bile salts, proteins, urea Main metabolic pathways - metabolic hub Carbohydrate - incoming - glycolysis, glycogenesis, lipogenesis, citric acid cycle, ETS Low blood glucose - glycogenolysis, gluconeogenesis Lipid - incoming - fatty acid oxidation, citric acid cycle, ETS, cholesterol synthesis, ketone body synthesis Surplus fuel - fatty acid and triacylglycerol synthesis Amino acids - protein synthesis Synthesis of nitrogenous compounds, glucose, urea Metabolic Profile: Liver
Tissue Interrelationships: Liver as Fuel Provider for Other Tissues Glucose provider - glycogenolysis, gluconeogenesis Fatty acid provider Excess fuel converted to triacylglycerols then VLDLs Provide fatty acids to other tissues or for storage in adipose tissue Ketone body provider Soluble form of fatty acid fuel Produced when blood glucose level low
Tissue Interrelationships: Liver and Skeletal Muscle Cori Cycle
Tissue Interrelationships: Liver and Skeletal Muscle Alanine-Glucose Cycle
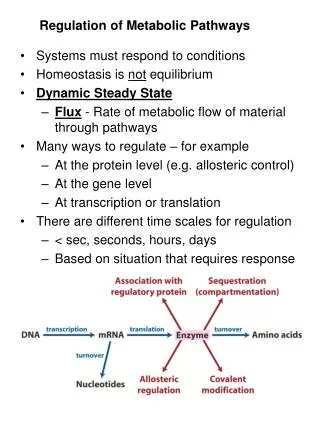
cyclic AMP ATP phosphorylated proteins protein kinase Mechanism of Hormone Action: Glucagon and Epinephrine adenylyl cyclase hormone hormone binds to receptor and stimulates adenylyl cyclase receptor adenylyl cyclase catalyzes synthesis of secondary messenger (cAMP) Glucagon (liver) glycogenesis (–) Inhibits glycogen synthase glycogenolysis (+) Stimulates glycogen phosphorylase glycolysis (–) Inhibits phosphofructokinase gluconeogenesis (+) Stimulates fructose 1,6-phosphatase Epinephrine (liver) cAMP stimulates protein kinase to catalyze phophorylation of key proteins glycogenesis (–) Inhibits glycogen synthase glycogenolysis (+) Stimulates glycogen phosphorylase Glucagon and Epinephrine (adipose tissue) glycolysis (–) Inhibits phosphofructokinase gluconeogenesis (+) Stimulates fructose 1,6-phosphatase Epinephrine (skeletal muscle) Stimulates lipase lipolysis (+) glycogenesis (–) Inhibits glycogen synthase glycogenolysis (+) Stimulates glycogen phosphorylase glycolysis (+) Stimulates phosphofructokinase
Insulin binds to receptor Stimulates synthesis of secondary messenger (inositol triphosphate, IP3 ) IP3 activates protein kinase that in turn catalyzes phosphorylation of key enzymes Mechanism of Hormone Action: Insulin Processes and enzymes affected (take in and use fuel) Stimulates glucose uptake (liver, muscle, adipose tissue) Stimulates glycogen synthase (liver and muscle) glycogenesis (+) Inhibits glycogen phosphorylase (liver and muscle) glycogenolysis (–) Stimulates fatty acid synthesis (liver) lipogenesis (+) Stimulates phosphofructokinase glycolysis (+) Inhibits fructose 1,6-bisphophatase (liver gluconeogenesis Inhibits hormone-sensitive lipase (adipose cells) lipolysis (–)
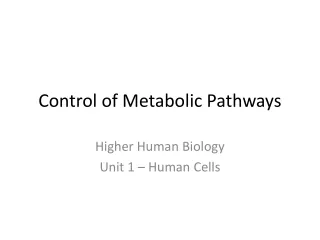
Interplay between insulin and glucagon
Normal Daily Cycle for Glycogen 100 g 75 g
Glucose Production by Liver and Kidney During First 10 Days of Fasting
Glucose 100 Ketone bodies 50 All other use of glucose 50 Adipose-tissue lipolysis 180 Muscle-protein degradation 75 Glucose 120 Ketone bodies 150 Fuel output of the kidney 30 Fuel Metabolism in Starvation Amount formed or consumed in 24 hours (grams) Fuel exchanges and consumption 3rd day 40th day Fuel use by the brain 40 100 40 Fuel mobilization 180 20 Fuel output of the liver 40 150 40
Metabolic Adjustment by the Liver During Prolonged Fasting or in Uncontrolled Diabetes