Download
1 / 16
160 likes | 317 Views
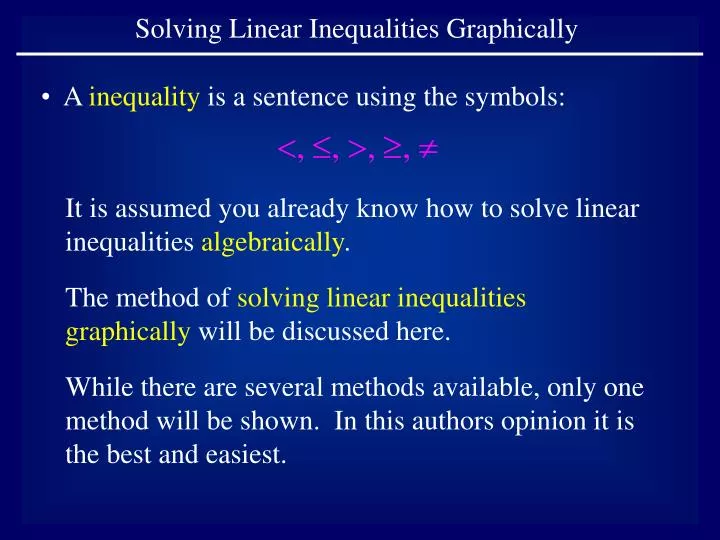
Solving Linear Inequalities Graphically. A inequality is a sentence using the symbols:. It is assumed you already know how to solve linear inequalities algebraically. The method of solving linear inequalities graphically will be discussed here.

E N D
Solving Linear Inequalities Graphically • A inequality is a sentence using the symbols: It is assumed you already know how to solve linear inequalities algebraically. The method of solving linear inequalities graphically will be discussed here. While there are several methods available, only one method will be shown. In this authors opinion it is the best and easiest.
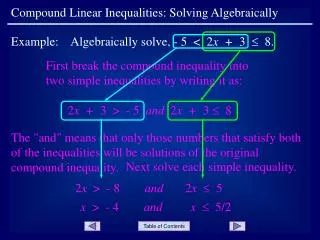
Example 1 Solve: Move all terms to the left hand side of the inequality. It doesn’t make any difference if we combine terms. Let y1 equal the left side.
Since y1 is the left hand side, and 0 is the right hand side, we have … We want to find all x-values for which y1 is less than or equal to zero.
Break this expression up into two parts, and consider what it means graphically. The y-values are negative means points are below the x-axis The y-values are zero means points are on the x-axis
Enter the expression into y1 on the calculator. Graph using Zoom|ZStandard. Using Trace we find that the x-intercept is located at x = 5.
Recall that we want to find all x-values for which y1 is less than or equal to zero. Identify the portion of the graph where points are below the x-axis. The x-values corresponding to the points in red on the graph are the solutions to the inequality.
Shade the portion of the x-axis that corresponds to the points in red. Write the answer based on the portion that is shaded green. Note that the inequality symbol is ≤, since the original problem included the equals symbol.
Example 2 Solve: Move all terms to the left hand side of the inequality. It doesn’t make any difference if we combine terms. Let y1 equal the left side.
Since y1 is the left hand side, and 0 is the right hand side, we have … We want to find all x-values for which y1 is greater than zero.
Consider what this means graphically. Since the y-values are positive, points are above the x-axis
Enter the expression into y1 on the calculator. Graph using Zoom|ZStandard. To get a better view, use Window to set the x-values at [-5,20]
Graph Using Trace we find that the x-intercept is located at x = 8.
Recall that we want to find all x-values for which y1 is greater than zero. Identify the portion of the graph where points are above the x-axis. The x-values corresponding to the points in red on the graph are the solutions to the inequality.
Shade the portion of the x-axis that corresponds to the points in red. Write the answer based on the portion that is shaded green. Note that the inequality symbol is >, since the original problem did not include the equals symbol.
Important: compare the inequality signs … Original Inequality Answer In this problem, both signs are the same. This is not always the case! Use the green shaded line on the x-axis of your graph to determine the direction of the sign in the answer.