Download
1 / 9
90 likes | 110 Views
This report outlines the goals, motivations, available data, and software features related to the development of a plasma diagnostic system incorporating automated Optical Emission Spectroscopy (OES) and Z-scan sensors on the LAM 9400 tool. The report discusses the challenges in characterizing plasma signals, the importance of extracting meaningful features from data, and the software tools being developed for data exploration and fault detection. Further goals for deploying automated fault detection systems and real-time instability detection are also outlined.

E N D
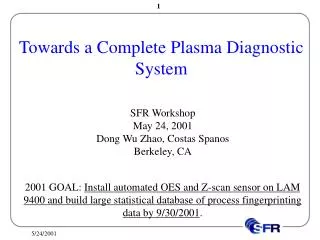
Towards a Complete Plasma Diagnostic System SFR Workshop May 24, 2001 Dong Wu Zhao, Costas Spanos Berkeley, CA 2001 GOAL: Install automated OES and Z-scan sensor on LAM 9400 and build large statistical database of process fingerprinting data by 9/30/2001.
Motivation • Plasma signals are difficult to characterize. • Drifts are subject to preventive maintenance, machine aging, chamber memory effects, etc. • One needs to describe signals both qualitatively and qualitatively by syntactic analysis. • One needs to extract meaningful features effectively from a large amount of data, for endpoint detection, wafer state modeling, etc. • Useful diagnostic signals come from a variety of sensors (OES, RF, etc), and must be combined for best diagnostic results.
Available Data from LAM 9400 • We have three distyinct sources of signals: • Optical Emission Spectroscopy (200 – 1100 nm). • Z-scan signals of current voltage, impedance, at five harmonics of 13.56 Mhz. (sensor and software donated by Advanced Energy) • Regular machine signals & settings, power, pressure, temperature, gas flow rate. • An automated data management system monitors all three data sources and builds a large data base over time. machine settings machine signals Z OES
Hardware Setup in the Berkeley Microlab Workstation SECII Lam 9400 OES sensor Z-scan sensor
OES CF2 line for Endpoint Detection This is a Cl2 poly etch step. CF2 lines 321nm, 275nm show transition down to 1% area exposure. Notice that CF4 etches oxide.
Wafer State Modeling of Uniformity & Etch Rate: combined sensor signals give the best results
Database Exploring Software Features • We are developing a software tool to visually explore the nature of data. • Select data based on date/time, recipe, or machine settings. • Generate machine settings and signal value distributions. • Compute signal correlation. • Generate within-wafer plot, I.e., signal vs. time. • Generate cross-wafer plot, I.e., signal vs. signal.
Assign codes to OES peaks, Z-scan harmonics, and machine signals: Large increase: 2 Moderate increase: 1 Unchanged: 0 Moderate decrease: -1 Large decrease: -2 Selectively monitor numerical values of certain signals. For example, if pressure consistently drifts away from the setting point, we should fire an alarm. Syntactic Analysis Put the code in a stream: {OES peak codes}{Z-scan harmonic codes}{machine signal codes}, e.g., {0 0 0 1 0 2 0…. 0 –1}{0 0 –2 –1 … 0 1 0}{0 2 1 0 … 0 –1 0}
2002 and 2003 Goals Deploy automated fault detection system using high sampling rate RF fingerprinting. Study automated generation of syntactic analysis rules for RF fingerprinting, by 9/30/2002. Study systems of real-time instability detection and plasma stabilization control; perform field studies of automated OES classification for fault diagnosis, by 9/30/2003.