Download
1 / 1
10 likes | 124 Views
Stories a Mushroom Told Me: 13 C and 15 N in a Pine FACE Study Reveal Fungal Functioning. Erik A. Hobbie 1 , Kirsten Hofmockel 2 , Linda van Diepen 3 , 1 ESRC-EOS, University of New Hampshire; 2 Iowa State University; 3 Department of Natural Resources, UNH. Abstract

E N D
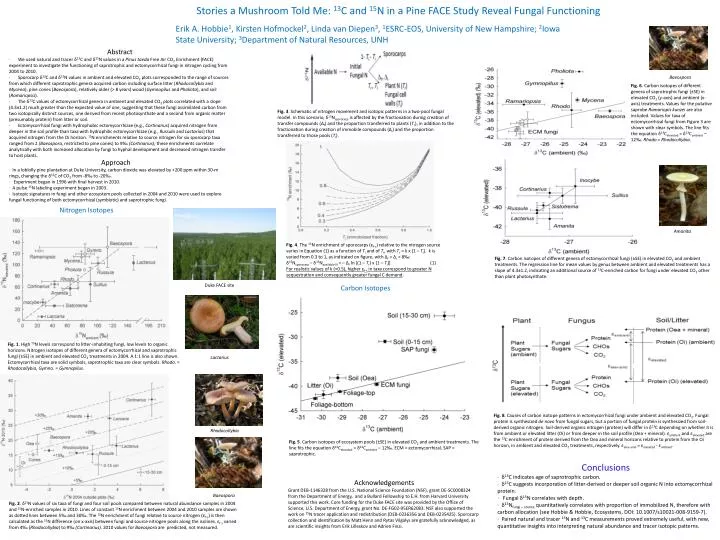
Stories a Mushroom Told Me: 13C and 15N in a Pine FACE Study Reveal Fungal Functioning Erik A. Hobbie1, Kirsten Hofmockel2, Linda van Diepen3, 1ESRC-EOS, University of New Hampshire; 2Iowa State University; 3Department of Natural Resources, UNH Abstract ∙ We used natural and tracer δ13C and δ15N values in a Pinus taeda Free Air CO2 Enrichment (FACE) experiment to investigate the functioning of saprotrophic and ectomycorrhizal fungi in nitrogen cycling from 2004 to 2010. ∙ Sporocarp δ13C and δ15N values in ambient and elevated CO2 plots corresponded to the range of sources from which different saprotrophic genera acquired carbon including surface litter (Rhodocollybiaand Mycena), pine cones (Baeospora), relatively older (> 8 years) wood (Gymnopilus and Pholiota), and soil (Ramariopsis). ∙ The δ13C values of ectomycorrhizal genera in ambient and elevated CO2 plots correlated with a slope (4.3±1.2) much greater than the expected value of one, suggesting that these fungi assimilated carbon from two isotopically distinct sources, one derived from recent photosynthate and a second from organic matter (presumably protein) from litter or soil. ∙ Ectomycorrhizal fungi with hydrophobic ectomycorrhizae (e.g., Cortinarius)acquired nitrogen from deeper in the soil profile than taxa with hydrophilic ectomycorrhizae (e.g., Russula and Lactarius) that acquired nitrogen from the Oi horizon. 15N enrichments relative to source nitrogen for six sporocarp taxa ranged from 2 (Baeospora, restricted to pine cones) to 9‰ (Cortinarius);these enrichments correlate analytically with both increased allocation by fungi to hyphal development and decreased nitrogen transfer to host plants. Baeospora Fig. 6. Carbon isotopes of different genera of saprotrophic fungi (±SE) in elevated CO2 (y-axis) and ambient (x-axis) treatments. Values for the putative saprobe Ramariopiskunzeiare also included. Values for taxa of ectomycorrhizal fungi from Figure 3 are shown with clear symbols. The line fits the equation δ13Celevated = δ13Cambient – 12‰. Rhodo = Rhodocollybia. Fig. 3. Schematic of nitrogen movement and isotopic patterns in a two-pool fungal model. In this scenario, δ15Nsporocarp is affected by the fractionation during creation of transfer compounds (Δf) and the proportion transferred to plants (Tr), in addition to the fractionation during creation of immobile compounds (Δi) and the proportion transferred to those pools (Ti). Approach ∙ In a loblolly pine plantation at Duke University, carbon dioxide was elevated by +200 ppm within 30-m rings, changing the δ13C of CO2 from -8‰ to -20‰. ∙ Experiment began in 1996 with final harvest in 2010. ∙ A pulse 15N labeling experiment began in 2003. ∙ Isotopic signatures in fungi and other ecosystem pools collected in 2004 and 2010 were used to explore fungal functioning of both ectomycorrhizal (symbiotic) and saprotrophic fungi. Nitrogen Isotopes Amanita Fig. 4. The 15N enrichment of sporocarps (εf-s) relative to the nitrogen source varies in Equation (1) as a function of Ti and of Tr, with Tr = k x (1 – Ti). k is varied from 0.3 to 1, as indicated on figure, with Δf = Δi = 8‰: δ15Nsporocarp – δ15Navailable N = – Δfln [(1 – Tr) x (1 – Ti)] (1) For realistic values of k (<0.5), higher εf-s in taxa correspond to greater N sequestration and consequently greater fungal C demand. Fig. 7. Carbon isotopes of different genera of ectomycorrhizal fungi (±SE) in elevated CO2 and ambient treatments. The regression line for mean values by genus between ambient and elevated treatments has a slope of 4.3±1.2, indicating an additional source of 13C-enriched carbon for fungi under elevated CO2 other than plant photosynthate. Duke FACE site Carbon Isotopes Fig. 1. High 15N levels correspond to litter-inhabiting fungi, low levels to organic horizons. Nitrogen isotopes of different genera of ectomycorrhizal and saprotrophic fungi (±SE) in ambient and elevated CO2 treatments in 2004. A 1:1 line is also shown.Ectomycorrhizal taxa are solid symbols, saprotrophic taxa are clear symbols. Rhodo. = Rhodocollybia, Gymno. = Gymnopilus. • Lactarius Fig. 8. Causes of carbon isotope patterns in ectomycorrhizal fungi under ambient and elevated CO2. Fungal protein is synthesized de novo from fungal sugars, but a portion of fungal protein is synthesized from soil-derived organic nitrogen. Soil-derived organic nitrogen (protein) will differ in δ13C depending on whether it is from ambient or elevated litter (Oi) or from deeper in the soil profile (Oea + mineral). εambient and εelevated are the 13C enrichment of protein derived from the Oea and mineral horizons relative to protein from the Oi horizon, in ambient and elevated CO2 treatments, respectively. εelev-amb = εelevated - εambient. Rhodocollybia Fig. 5. Carbon isotopes of ecosystem pools (±SE) in elevated CO2 and ambient treatments. The line fits the equation δ13Celevated = δ13Cambient – 12‰. ECM = ectomycorrhizal, SAP = saprotrophic. Conclusions ∙ δ13C indicates age of saprotrophic carbon. ∙ δ13C suggests incorporation of litter-derived or deeper soil organic N into ectomycorrhizal protein. ∙ Fungal δ15N correlates with depth. ∙ δ15Nfungi – source quantitatively correlates with proportion of immobilized N, therefore with carbon allocation (see Hobbie & Hobbie, Ecosystems, DOI: 10.1007/s10021-008-9159-7). ∙ Paired natural and tracer 15N and 13C measurements proved extremely useful, with new, quantitative insights into interpreting natural abundance and tracer isotopic patterns. • Acknowledgements • Grant DEB-1146328 from the U.S. National Science Foundation (NSF), grant DE-SC0008324 from the Department of Energy, and a Bullard Fellowship to E.H. from Harvard University supported this work. Core funding for the Duke FACE site was provided by the Office of Science, U.S. Department of Energy, grant No. DE-FG02-95ER62083. NSF also supported the work on 15N tracer application and redistribution (DEB-0236356 and DEB-0235425). Sporocarp collection and identification by Matt Henn and Rytas Vilgalys are gratefully acknowledged, as are scientific insights from Erik Lilleskov and AdrienFinzi. Baeospora Fig. 2. δ15N values of six taxa of fungi and four soil pools compared between natural abundance samples in 2004 and 15N-enriched samples in 2010. Lines of constant 15N enrichment between 2004 and 2010 samples are shown as dotted lines between 5‰ and 30‰. The 15N enrichment of fungi relative to source nitrogen (εf-s) is then calculated as the 15N difference (on x-axis) between fungi and source nitrogen pools along the isolines. εf-s varied from 4‰ (Rhodocollybia) to 9‰ (Cortinarius). 2010 values for Baeosporaare predicted, not measured.