Download
1 / 14
140 likes | 258 Views
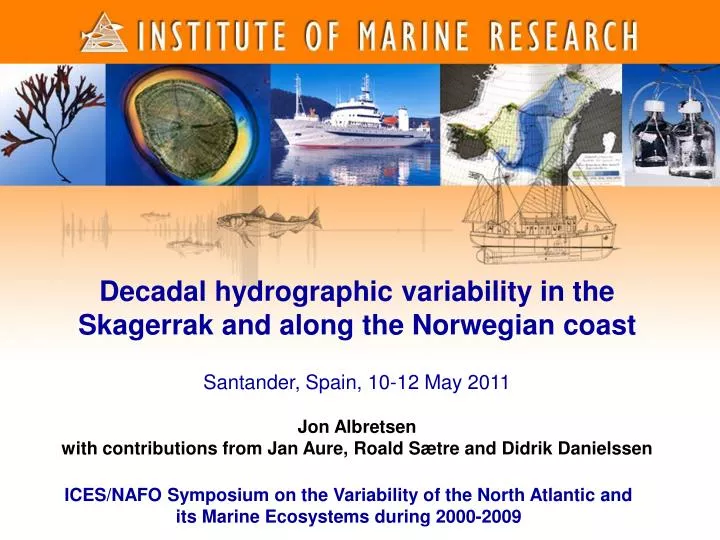
Decadal hydrographic variability in the Skagerrak and along the Norwegian coast Santander, Spain, 10-12 May 2011. Jon Albretsen with contributions from Jan Aure, Roald Sætre and Didrik Danielssen.

E N D
Decadal hydrographic variability in the Skagerrak and along the Norwegian coast Santander, Spain, 10-12 May 2011 Jon Albretsen with contributions from Jan Aure, Roald Sætre and Didrik Danielssen ICES/NAFO Symposium on the Variability of the North Atlantic and its Marine Ecosystems during 2000-2009
Content Decadal hydrographic variability in the Skagerrak and along the Norwegian coast Analysis is primarily based on measurements Focus on the hydrographic properties of the Norwegian Atlantic Drift and implications to the North Sea and Skagerrak and the Norwegian coast from the south to the Barents Sea.
Data used The fixed stations along the Norwegian coast 1940’s – 2010 (IMR) The Skagerrak transect (Torungen – Hirtshals) 1952 – 2010 (IMR) The Shetland polygon 1940’s – 2010 (NISE and ICES) Winter inflow to the North Sea 1955 – 2008 (IMR, NORWECOM)
From real values to normalized values Want to compare hydrographic properties at areas with different level of variability – normalize all time series according to the 1961-90 state. Interpretation: the value normalized value is in terms of the number of standard deviations the value is above or below the mean Data from the winter season (JFM) is applied in our analysis as we believe it better reflects the long-term climatic signals.
Hydrographic decadal changes Hirtshals Torungen Lista Utsira Eggum Ingøy Depth 200m, representing Atlantic water masses
Hydrographic changes in Atlantic water masses for the last decade from south to north Skagerrak → Nordic Sea → Barents Sea
Modelled winter inflow to the North Sea between Norway (Utsira) and the Orkneys
Comparison of decadal changes in temperature with the salinity change West of Shetland Skagerrak and the Norwegian coast Normalized values at 200m depth from 1940-2009 (sources: NISE and ICES) Normalized decadal means at 200m depth from 1940-2009 from 9 stations in Skagerrak and along the Norwegian coast
Quantifying the temperature increase Decadal anomalies for 1990-99 and 2000-09 (JFM) Hátun et al. (2005) South → North
Reflecting the global temperature increase ≈ 0.5 oC Decadal anomalies at 200m depth from 1940-2009 from 9 stations in Skagerrak and along the Norwegian coast Red: Before 1990 Blue: After 1990
Hydrographic conditions in the Skagerrak bottom water – decadal variability Sill depth 270m Max. depth 700m
Hydrographic conditions in the Skagerrak bottom water – time series from the 1960’s and the last decade 2000-2010 1960-69 T S D O2 600m depth
Summary • Measurements of the hydrographic properties of the Atlantic water in the Shetland-Faroe Island channel, the Skagerrak and along the Norwegian coast indicate an enhanced warming the last decade. • After increased inflow of Atlantic water masses into the North Sea in the 1990’s, the volume transport has normalized (i.e., been reduced) during the last decade. Despite the lower inflow of Atlantic water during the last decade, the temperature has increased. • The warming is quantified to about 1 oC where half of this is accounted for in the decadal fluctuating strength of the Subpolar Gyre. The remaining increase in temperature (0.5 oC) reflects the monitored NOAA global temperature increase well. • Cold winters in the North Sea area (as in 2010) may induce a cooling of the Skagerrak bottom waters, and this type of physical process may have implications to the marine life, e.g. the shrimp stock.