Download
1 / 80
800 likes | 955 Views
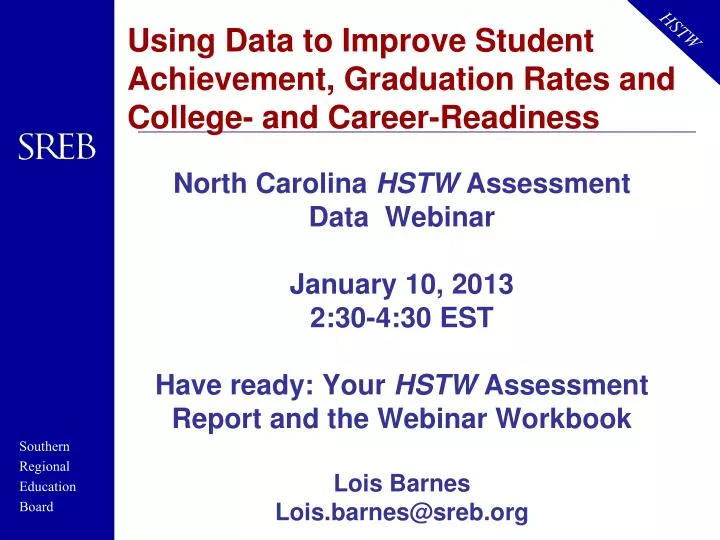
Using Data to Improve Student Achievement, Graduation Rates and College- and Career-Readiness. North Carolina HSTW Assessment Data Webinar January 10, 2013 2:30-4:30 EST Have ready: Your HSTW Assessment Report and the Webinar Workbook Lois Barnes Lois.barnes@sreb.org. Do Now!.

E N D
Using Data to Improve Student Achievement, Graduation Rates and College- and Career-Readiness North CarolinaHSTW Assessment Data Webinar January 10, 2013 2:30-4:30 EST Have ready: Your HSTW Assessment Report and the Webinar Workbook Lois Barnes Lois.barnes@sreb.org
Do Now! • Introduce who and where you are from • On which key practice have you focused most of your improvement efforts in the past year or two?
Data Webinar Objectives • Understand the 2012 HSTW Assessment and report • Use data to analyze your school’s challenges and develop an action plan for addressing those challenges • Focus specifically on HSTW Assessment indicators for Quality Career Technical Studies, Literacy and Mathematics
What will it take to accelerate student achievement? • Improvement at the same time • Student achievement • Graduation rates • College- and career-readiness • Using data for improvement • Process • Performance
Why are data important? • Replace hunches with facts • Enable us to address root causes instead of symptoms • Enable us to determine the effects of implemented practices • Assist us in understanding how school and classroom practices relate to student achievement
Data cannot help when… • Data are not valid or reliable • The appropriate questions are not asked • Analysis is not used for making wise decisions • There is no commitment by teachers and administrators to change school and classroom practices when data indicates the need for change
HSTW – An Effort-Based Model • Effort, not ability • Focus on improving students’ experiences • Focus on things we can control • Take ownership of what we can control
HSTW Readiness Goals • Reading = 250; Mathematics = 257; Science = 258 • Students performing at this level are able to enter postsecondary studies without needing additional preparation and/or are able to pass most employer exams for entry-level jobs. See pages 5-6 in the handout that was emailed to you for performance level descriptors.
2012 HSTW Assessment • NAEP-like subject tests • Reading, Mathematics, Science • Student Survey • Course history • School and classroom experiences • Teacher Survey • Administered to all or a random sample of 60+ seniors in January/February 2012 • Comprehensive report disaggregating achievement by school and classroom practices
Test Content • Reading • 80% informational texts; 20% literary non-fiction texts • Includes meaning vocabulary • Includes paired texts (to assess critical analysis) • Does not include literary fiction or poetry
Test Content • Mathematics • 11% Number Properties and Operations • 29% Measurement/Geometry • 24% Data Analysis, Statistics and Probability • 36% Algebra
Test Content • Science • 43% Life Sciences • 42% Physical Sciences • 15% Earth and Space Science
2012 Participation • HSTW • 555 schools • 29,794 students • 26,080 teachers • TCTW • 163 centers • 9,149 students • 3,397 teachers • NC HSTW • 20 schools • 1,150 students • 1,079 teachers, including 784 academic and 295 CTE teachers
Report Format • Executive Summary (pg. 1-2) • Overview (pg. 3-24) • Full Report • Indices (pg. 25-36) • Benchmarks (pg. 37-60) • Student survey results (pg. 62-183) • Teacher survey results (pg. 184-214) • Appendix (pg. 215-230)
Test Details • Reading • 75 minutes • 46 MC questions • Mathematics • 80 minutes • 55 MC questions • Graphing calculator for some questions • Science • 55 minutes • 55 MC questions
Share • What value does this data provide? • How can you use this executive summary in your school/district/state? Type your responses now….
Understanding the Indices • Based on the HSTW Key Practices • Examples – Literacy Across the Curriculum, High Expectations • A series of indicators (and frequency) are identified for each practice • Example from Literacy – Students often revised their essays or other written work several times to improve their quality • The number of indicators experienced determines the level of emphasis • Example – Intensive = 8-10 indicators
Analyzing Differences Topic One pages 7 and 8 in your webinar workbook
Comparisons • Anytime you are analyzing data you need to ask yourself – “compared to what?” • Historical data? • National averages? • Other schools? • Defined standards? • The data does not mean anything unless there is a comparison.
Exploring Achievement Gaps Pages 9 and 10 in your webinar workbook
Achievement Gaps • Increasing attention on improving the performance of all student groups and closing gaps between high- and lower-achieving groups • Need to understand differences in achievement and experiences between groups in order to better serve all students
Think About… • How did your site’s achievement change from 2010 to 2012? Compare to high-scoring sites? • What actions might high-scoring sites have taken to result in higher achievement? • What actions can be taken to increase the achievement of all groups of students? Type your responses now….
Quality Career/Technical Studies and Work-Based Learning Topic Two Pages 11-12 in your webinar workbook
Key Practices • Provide more students access to intellectually challenging career/technical studies in high-demand fields that emphasize the higher-level mathematics, science, literacy and problem-solving skills needed in the workplace and in further education. • Enable students and their parents to choose from programs that integrate challenging high school studies and work-based learning and are planned by educators, employers and students.
A Broader Definition of Rigor • Application-based learning of academic knowledge and skills through authentic problems, projects and tasks in career fields of interest • Problem-based learning that develops students’ ability to learn and use academic knowledge in the context of a problem that interests them • Depth-based learning that provides opportunities for students to explore certain topics of interest and gain greater depth of understanding
A Broader Definition of Rigor • Blended programs of academic and CT studies that graduate more students prepared for college and careers, including the combination of work and further study • Alternative assessments — in subjects other than reading, writing and math — that measure how well students handle complex materials, including approved industry-certification exams, readiness assessments for postsecondary study, school-evaluated senior projects, or portfolios evaluated using a state-developed scoring guide.
Making CT Courses Intellectually Demanding • Embed reading, writing and mathematics standards essential for students who will pursue college or career studies • Develop instructional materials and a syllabus for the course • Blend academic and technical content through authentic projects • Align course content with college- and career-readiness standards
Making CT Courses Intellectually Demanding • Courses should require students to • do substantial reading and reflective writing in the career field • describe orally what they learn through class projects, problem-solving activities and laboratory work • develop analytical thinking skills
Quality CT Studies Indicators • They took a mathematics course during their senior year. • They took a science course during their senior year. • They were encouraged to take a combination of academic and career/technical courses. • They completed a senior project that included researching a topic, creating a product or performing a service and presenting it to the class or others.
Quality CT Studies Indicators • They had challenging assignments in their career/technical classes at least monthly. • They completed a project that first required some research and a written plan before completing the task in their career/technical classes at least once a semester. • They used computer software or other technology related to their career/technical area to complete assignments at least weekly. • They made journal or lab manual entries that recorded their class work in their career/technical classes at least weekly.
Integrating Academics into CT Studies Indicators • They read and interpreted technical books and manuals to complete assignments in their career/technical classes at least weekly. • They read a career-related article and demonstrated understanding of the content in their career/technical classes at least monthly. • They used computer skills to complete an assignment or project in their career/technical classes at least weekly. • They used mathematics to complete challenging assignments in their career/technical classes at least weekly.
Integrating Academics into CT Studies Indicators • Their career/technical teachers sometimes oroften stressed reading. • Their career/technical teachers sometimes oroften stressed writing. • Their career/technical teachers often stressed mathematics. • Their career/technical teachers often stressed science.
Integrating Academics into CT Studies - All North Carolina Sites -2012
Conditions for Supporting Integration • Common planning time • Standards-based, not activity-based • Create organizational structure that will support teacher collaboration • Provide large blocks of instructional time for completion of complex tasks • Provide professional development to support teachers • Establish clear expectations for teachers; collaboration by invitation does not work