Download
1 / 1
10 likes | 95 Views
Modeling Pain score in clinical trials using a joint survival-longitudinal mixed model with a Beta distribution in presence of missing values not occurring at random. Marion Bouillon-Pichault, Bruno Boulanger, Astrid Jullion, Bianca Teodorecu ARLENDA, Belgium. Introduction Context

E N D
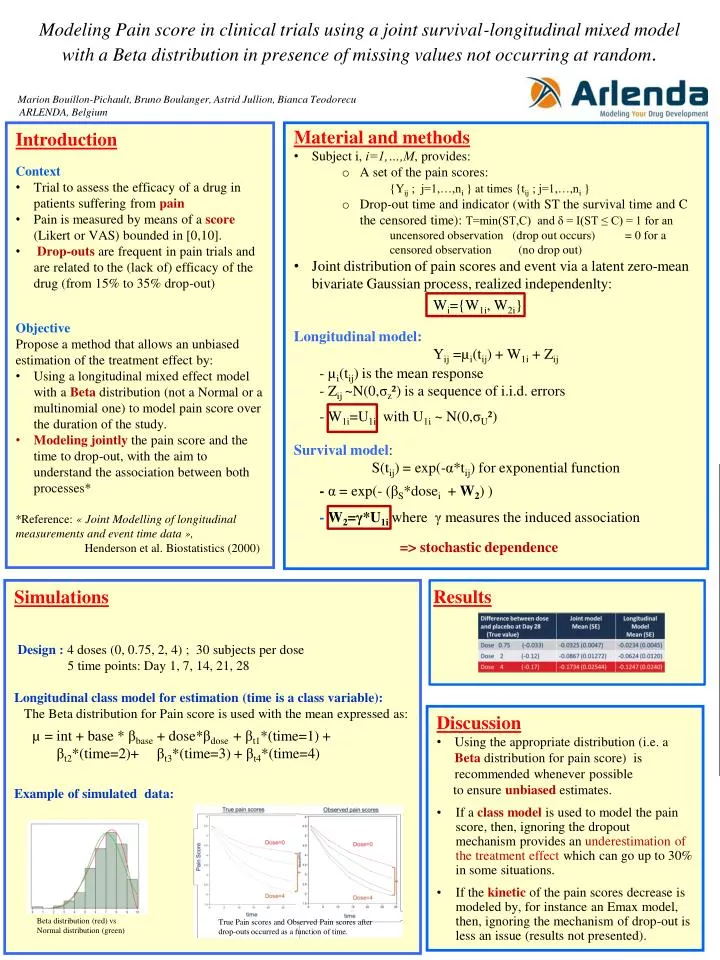
Modeling Pain score in clinical trials using a joint survival-longitudinal mixed model with a Beta distribution in presence of missing values not occurring at random. Marion Bouillon-Pichault, Bruno Boulanger, Astrid Jullion, Bianca Teodorecu ARLENDA, Belgium • Introduction • Context • Trial to assess the efficacy of a drug in patients sufferingfrompain • Pain is measured by means of a score(Likert or VAS) bounded in [0,10]. • Drop-outs are frequent in pain trials and are related to the (lack of) efficacy of the drug (from 15% to 35% drop-out) • Objective • Propose a methodthatallows an unbiased estimation of the treatmenteffect by: • Using a longitudinal mixed effect model with a Beta distribution (not a Normal or a multinomial one) to model pain score over the duration of the study. • Modelingjointly the pain score and the time to drop-out, with the aim to understand the association between both processes* • *Reference: « Joint Modelling of longitudinal measurements and event time data », • Henderson et al. Biostatistics (2000) • Material and methods • Subject i, i=1,…,M, provides: • A set of the pain scores: • {Yij ; j=1,…,ni } at times {tij ; j=1,…,ni } • Drop-out time and indicator (with ST the survival time and C the censored time): T=min(ST,C) and δ = I(ST ≤ C) = 1 for an uncensored observation (drop out occurs) = 0 for a • censored observation (no drop out) • Joint distribution of pain scores and event via a latent zero-meanbivariateGaussianprocess, realizedindependenlty: • Longitudinal model: • Yij =µi(tij) + W1i + Zij • - µi(tij) is the meanresponse • - Zij~N(0,σz²) is a sequence of i.i.d. errors • - W1i=U1iwith U1i ~ N(0,σU²) • Survival model: • S(tij) = exp(-α*tij) for exponentialfunction • - α = exp(- (βS*dosei + W2) ) • - W2=γ*U1iwhereγmeasures the induced association Wi={W1i, W2i} => stochastic dependence Results Simulations Design : 4 doses (0, 0.75, 2, 4) ; 30 subjects per dose 5 time points: Day 1, 7, 14, 21, 28 Longitudinal class model for estimation (time is a class variable): The Beta distribution for Pain score is used with the mean expressed as: Example of simulated data: • Discussion • Using the appropriate distribution (i.e. a Beta distribution for pain score) is recommended whenever possible • to ensure unbiased estimates. • If a class model is used to model the pain score, then, ignoring the dropout mechanism provides an underestimation of the treatment effect which can go up to 30% in some situations. • If the kinetic of the pain scores decrease is modeled by, for instance an Emax model, then, ignoring the mechanism of drop-out is less an issue (results not presented). µ = int + base * βbase + dose*βdose + βt1*(time=1) + βt2*(time=2)+ βt3*(time=3) + βt4*(time=4) Beta distribution (red) vsNormal distribution (green) True Pain scores and Observed Pain scores after drop-outs occurred as a function of time.