Download
1 / 21
210 likes | 286 Views
Explore possible measures to reduce human greenhouse gas emissions with a focus on sustainable solutions and global climate policies for a greener future.

E N D
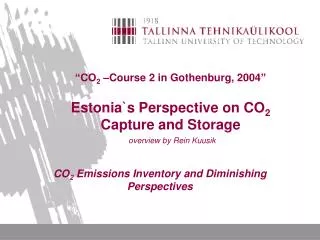
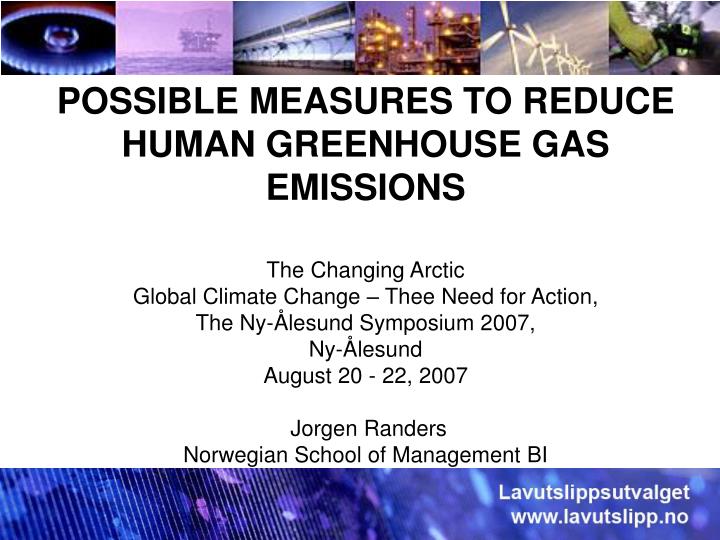
POSSIBLE MEASURES TO REDUCE HUMAN GREENHOUSE GAS EMISSIONSThe Changing ArcticGlobal Climate Change – Thee Need for Action,The Ny-Ålesund Symposium 2007,Ny-Ålesund August 20 - 22, 2007Jorgen RandersNorwegian School of Management BI
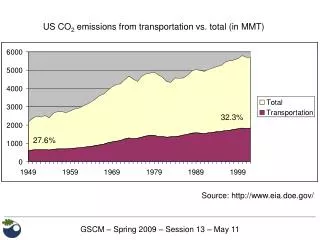
CO2 EMISSIONS FROM HUMAN ACTIVITY GtCO2 per year From land use change SUSTAINABLE From fossil fuels
Stern: Necessary reduction to achieve 450-550 ppm CO2e Stabilising below 450ppm CO2e would require emissions to peak by 2010 with 6-10% p.a. decline thereafter. If emissions peak in 2020, we can stabilise below 550ppm CO2e if we achieve annual declines of 1 – 2.5% afterwards. A 10 year delay almost doubles the annual rate of decline required. Source: Taylor, on Stern Review 2006
THE NEED: 50 % CUT IN CO2 BY 2050 GtCO2 per year KYOTO From land use change SUSTAINABLE From fossil fuels 2050 2100
Global Greenhouse Gas Emissions Sum: 65% Sum: 35% Source: Taylor, on Stern Review 2006
WWF: COVERING GLOBAL ENERGY NEED Source: WWF, Climate Solutions, 2007 Increased energy efficiency New renewable energy supply Carbon capture and storage
IEAE: CO2 Reduction by Sector MAP Scenario 2050 32 Gt CO2 Reduction Industry 10% Energy & feedstock effic. 6% Source: Unander, on IEA Energy Technology Perspectives 2006 Materials & products effic. 1% Process innovation 1% Cogen. & steam 2% Coal to gas 5% End-use efficiency 45% Buildings 18% Nuclear 6% Space heating 3% Fossil fuel gen. eff 1% Air conditioning 3% Lighting, misc. 3.5% Power Gen 34% CCS 12% Water heat., cooking 1% Appliances 7.5% Hydro 2% Biomass 2% Transport 17% Other renew. 6% Fuel economy in transport 17% CCS in fuel transformation 3% CCS in industry 5% Biofuels in transport 6% Fuel mix in building 5% and industry 2% End-use efficiency offers the largest potential (45%) Power Gen. 34%, CO2 Capture & Storage (CCS) 20%
– relative weight 30 % 30 % 20 % 20 % A GLOBAL SOLUTION –WHAT?
GHG ABATEMENT COST CURVE Source: McKinsey Quarterly, No1 2007
THE “REFERENCE PATH” TO 2050 • The result if Norway continues business as usual • Emissions increase by about 40 per cent to 2050
THE “LOW EMISSIONS PATH” TO 2050 • The result if Norway imple-ments the Commission’s total solution • Emissions fall to one third of Norway’s Kyoto obligation by 2050
SMALL EFFECT ON NORWAY’S GDP Reference path Low emissions path
THREATH 1: GLOBAL DECISION DELAYS • STRONG CLIMATE ACTION MAY BE DELAYED • BECAUSE OF: • The perceived high cost of action • Long time from cost to benefit • Immediate effects on distribution: loss of jobs • The tragedy of the climate commons • Initial damage strikes those who can’t afford to act • Legitimate unwillingness among the poor to commit • The tyranny of the cost-effective solution
THREATH 2: SELF-REINFORCING FEEDBACK IN THE CLIMATE SYSTEM • Global warming may become self-sustaining and • unstoppable because of: • Increased absorption of solar heat in an increasingly ice-free Arctic ocean, • Increased emissions of methane gas from melting tundra, • Reduced absorption of CO2 in acidic ocean water, • and other self-reinforcing mechanisms.