Download
1 / 41
410 likes | 545 Views
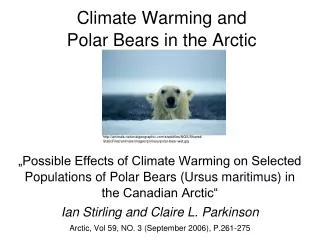
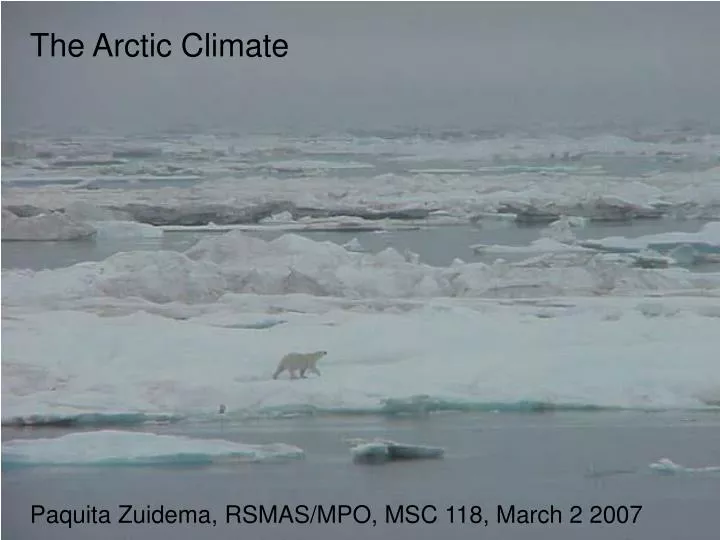
The Arctic Climate. Paquita Zuidema, RSMAS/MPO, MSC 118, March 2 2007. 29 Aug 1980. First some pure observations…. Change in annual mean temperature ( °C): 1956-2005. Global temperature anomalies in 2005 relative to 1951-1980.

E N D
The Arctic Climate Paquita Zuidema, RSMAS/MPO, MSC 118, March 2 2007
Changes of Alaskan station temperatures (F), 1949-2004[ from Alaska Climate Research Center ]
Submarine- measured sea ice thickness
Cumulativevolume changes of glaciers (ACIA, 2005)North AmericaScandinaviaRussiaNo. Hemis.
Satellite data tells us sea-level heights, since 1992 a rise of about 2 cm
spring Increased Spring And Summer Cloudiness summer 1982-1999 AVHRR data (Wang&Key, 2003) annual Persistent springtime cloud cover may advance snowmelt onset date (e.g., modeling study of Zhang 1996)
Permafrost (CCSM) Sept. sea-ice (CCSM) Sept. sea-ice (Observed) (Holland, Lawrence)
IPCC models: Projected Arctic (60-90ºN) change of surface air temperature relative to 1980-2000
Impact of 1 meter (3 feet) sea level rise on FL
Surface Heat Budget of the Arctic SHEBA
Early May ~ 76N, 165 W
spring Increased Spring And Summer Cloudiness summer 1982-1999 AVHRR data (Wang&Key, 2003) annual Persistent springtime cloud cover may advance snowmelt onset date (e.g., modeling study of Zhang 1996)
Surface-based Instrumentation: May 1-8 time series 8 dBZ -20 -45 -5 6 35 GHzcloudradar ice cloud properties km 4 2 depolarization lidar-determined liquid cloud base Microwave radiometer-derived liquid water paths 100 g/m^2 2 3 4 5 6 7 8 1 day day 4X daily soundings.Near-surface T ~ -20 C, inversion T ~-10 C 1 4 lidar cloud base 8 z -30C -10C
May 4 Cloud Particle Imager data …pristine ice particles from upper cloud ...super-cooled drizzle
Jnoon = 60o Clouds decrease surface SW by 55 W m-2 ,increase LW by 49 W m-2 How do clouds impact the surface ? Surface albedo=0.86; most SW reflected back Clouds warm the surface, relative to clear skies with same T& T & RH, by time-mean 41 W m-2* (little impact at TOA) • Can warm 1m of ice by 1.8 K/day, or melt 1 cm of 0C ice per day, • barring any other mechanisms !
Great websites with real-time data, historical fotos: http://www.arctic.noaa.gov/ http://nsidc.org http://nsidc.org/cryosphere/glance http://nsidc.org/data/seaice-index/
Thank you ! Paquita Zuidema, RSMAS/MPO, MSC118, March 2 2007