Download
1 / 30
300 likes | 440 Views
Aviation Climatology. Andrew Rorke WFO LOX Los Angeles / Oxnard. What Is Aviation Climatology. A database of observations for a given TAF site The database contains Ceiling, Visibility, Wind Speed and Wind Direction data for every day and hour for (hopefully) the past 30 years.

E N D
Aviation Climatology Andrew Rorke WFO LOX Los Angeles / Oxnard
What Is Aviation Climatology • A database of observations for a given TAF site • The database contains Ceiling, Visibility, Wind Speed and Wind Direction data for every day and hour for (hopefully) the past 30 years.
What Good Is Aviation Climatology? • Given a fairly normal climatological day, climatology is probably the best forecast tool for ceiling and visibility changes. • For any given ceiling and visibility aviation climatology will produce a cig/vis forecast for the next 1 to 6 hours.
Drawbacks of Aviation Climatology • The day has to fairly normal. • There has to be low ceiling (040 AGL or less) or a low visibility (5SM or less) • It does not predict good flying weather turning to bad flying weather • It does, however, predict, bad weather getting worse
Aviation Climatology in the NWS • Consists of two programs • Ceiling and Visibility Distribution • Determines how normal the day is • Ceiling and Visibility Trend • Forecasts changes in Cig and Vis based on current conditions and climatology
Ceiling and Visibility Distribution Joint Ceiling and Visibility
Ceiling and Visibility Trend • Pick The TAF Site • Pick the Element • Visibility only • Ceiling only • Joint (combined to flight cat) • Chose the number of hours ahead to forecast
Ceiling and Visibility Trend • Chose a range of dates to pull data from • Smaller range might be more accurate, but might not sample low frequency events • Defaults to +/- 30 days from current
Ceiling and Visibility Trend • Choose your start hour for initial conditions • Default may be too much – try to use 1 or 2 hours
Ceiling and Visibility Trend • Enter the wind information • Again a smaller range will be more accurate provided there is enough data to sample
Ceiling and Visibility Trend • Enter the Ceiling and Visibility information • Unlike this example… try not to cross flight categories
Ceiling and Visibility Trend Results Vis Only – VFR is inferred – Count refers to total data points
Ceiling and Visibility Trend Results Cig Only – VFR is inferred – Count refers to total data points
Ceiling and Visibility Trend Results Both Cig and Vis – VFR is inferred – Count refers to total data points Note that the data points go down
Ceiling and Visibility TrendSummery • A great forecast tool when properly used. • Best for predicting burn off or changes to a pre-existing ceiling or fog obscuration • Works best during normal conditions
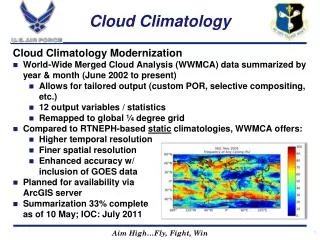
Aviation Climatology In The Southwest • Ceiling based Aviation Climatology is not ideally suited for the Southwest • The vast majority of Ceiling and Visibility restrictions occur on the coast • Aviation Climatology gives very little information on arrival times of lower flying conditions • Aviation Climatology does not make wind predictions (important to many SW airports)
KLAX – Los Angeles International • Concerns: • Ceiling Visibility Arrivals • Ceiling Visibility Changes • Ceiling Visibility Improvement • Sea Breeze Front • East Winds • Traditional Climatology only helps with 2 of the five problem areas
Pressure Gradient Aviation Climatology • Stratifying the observational data base using pressure gradients. • Would generate wind forecasts • Would give information on ceiling and visibility arrivals • Initially it might provide information on “not” events, but hopefully when combined with other information will be able to provide arrival forecasts.(KPRB combined with KSNS ceiling info)
Pressure Gradient Aviation Climatology • Which Gradient Values to use? • Must be chosen for each TAF site • Look At: • The Current Gradient • The 24 hour Change • The 12 hour Change (how different is it from the normal diurnal change) • The 3 hour change
Pressure Gradient Aviation Climatology • Calculate these gradients and trends and link them to their corresponding observational values • Use a database program such as Filemaker Pro • Use the database to search and sift the data • Use the database’s GUI creation capabilities to design a front end for the aviation desk
Pressure Gradient Aviation Climatology KLAX KPRB Use SNS-PRB and SFO-SBA By itself good with “no cig” forecast Needs to be linked with current conditions at KSNS for better arrival time forecast • Use LAX-DAG and LAX-BFL • Good with “not” forecast of sea breeze front • Good with east wind forecast with rain • So-so results with summertime east winds
Questions? Andrew Rorke andrew.rorke@noaa.gov